Maximize GPU Utilization for Model Training: Unlocking Peak Performance
Unleashing the Power of GPU, understanding the essential strategies for efficient Deep Learning Model Training without compromising on memory and hardware resources in Graphical Processing Units
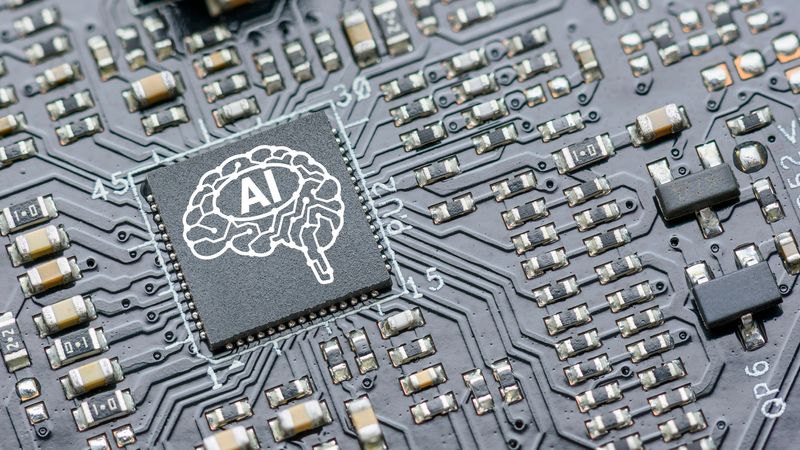
A GPU microchip for accelerated AI processing
Introduction
Graphics Processing Units (GPUs) have revolutionized the field of deep learning, enabling the training of complex neural networks at unprecedented speeds. GPU utilization in model training refers to the efficient use of these specialized processors to perform the massive parallel computations required for training deep learning models. By leveraging the thousands of cores in modern GPUs, researchers and data scientists can dramatically accelerate the training process, reducing time-to-insight and enabling the development of more sophisticated AI models.
However, suboptimal GPU utilization can lead to significant performance bottlenecks, wasted computational resources, and increased training times. Underutilized GPUs result in idle processing power, memory bandwidth limitations, and inefficient use of expensive hardware. This slows down research and development cycles and increases operational costs. This article will guide readers through the intricacies of maximizing GPU utilization for model training, providing practical strategies and techniques to harness the full potential of these powerful accelerators.
The Powerhouse Behind AI: Demystifying GPU Architecture
Graphics Processing Units (GPUs) have become the cornerstone of modern artificial intelligence, powering the computational demands of deep learning models. While there is no significant performance difference between Central Processing Units (CPUs) and GPUs for simpler networks, GPUs have proven significant and have shorter processing times for complex deep learning models. Therefore, GPUs are architected specifically for parallel processing of large data sets.
The fundamental difference between CPUs and GPUs lies in their core design philosophy. CPUs are optimized for sequential processing, featuring a few powerful cores with complex control logic and large caches. In contrast, GPUs contain thousands of smaller, more efficient cores designed to handle multiple tasks simultaneously.
Key components of a GPU include:
CUDA Cores: These are the basic computational units within the GPU core of NVIDIA GPUs, designed for graphic rendering, parallel processing of floating-point and integer operations.
Tensor Cores: Specialized cores that accelerate matrix multiplication, which are crucial for deep learning workloads. These are capable of mixed-precision computing (FP16 for computation, FP32 for accumulation) that boosts performance without compromising accuracy.
RT Cores: Dedicated units for real-time ray tracing acceleration for tasks like bounding volume hierarchy traversal and ray triangle intersections.
Memory Hierarchy:
Global Memory: High-capacity, but higher latency memory accessible by all cores.
Shared Memory: Low-latency memory shared within a block of cores.
Registers: Ultra-fast memory within each core.
Memory Controller: Manages data flow between different memory types and cores.
Streaming Multiprocessors (SMs): Groups of CUDA cores that work together on parallel tasks.
GPU architecture is optimized for parallel processing through several mechanisms:
SIMT (Single Instruction, Multiple Thread) execution model: Allows multiple threads to execute the same instruction on different data simultaneously.
High memory bandwidth: Enables rapid data transfer to feed the numerous cores.
Hardware scheduling: Efficiently manages thousands of threads with minimal overhead.
Multi-Level Parallelism: Using parallelism in multiple layers, threads, hardware, and instructions to achieve better efficiency.
Characteristic | CPU | GPU |
Core Count | Few (4-64 typically) | Many (thousands) |
Clock Speed | Higher (3-4 GHz) | Lower (1-2 GHz) |
Cache Size | Larger (MB range) | Smaller (KB range) |
Instruction Set | Complex, general-purpose | Streamlined, specialized |
Memory Bandwidth | Lower | Much higher |
Latency | Lower | Higher |
Task Optimization | Sequential processing | Parallel processing |
This architecture enables GPUs to process vast amounts of data in parallel, making them ideal for the matrix operations that form the backbone of deep learning algorithms. By leveraging thousands of cores simultaneously, GPUs can accelerate neural network training and inference by orders of magnitude compared to CPUs.
Suggested Reading: What is Unsupervised Learning: A Comprehensive Guide
CUDA: The Language of GPU Acceleration
CUDA (Compute Unified Device Architecture) is NVIDIA's parallel computing platform and programming model, introduced in 2006. It enables developers to harness the power of GPUs for general-purpose computing, providing a software layer that gives direct access to the GPU's virtual instruction set and parallel computational elements.
CUDA serves as an extension to programming languages like C, C++, and Fortran, allowing developers to write code that can be executed on both CPUs and GPUs. This unified approach simplifies the development process and enables efficient utilization of GPU resources for computationally intensive tasks.
At the heart of CUDA are CUDA cores, which are the fundamental processing units of NVIDIA GPUs. CUDA uses these cores for parallel processing. Threads are organized into blocks and grids for efficient scaling. CUDA threads use SIMT, executing the same instruction on different data, leading to high performance in GPU computing.
Understanding CUDA is crucial for optimizing GPU utilization in several ways:
Memory management: CUDA provides fine-grained control over different memory types (global, shared, constant), allowing developers to optimize data access patterns.
Thread organization: Proper thread and block configuration can significantly impact performance.
Kernel optimization: Writing efficient CUDA kernels requires understanding of GPU architecture and CUDA-specific optimizations.
Asynchronous operations: CUDA enables concurrent execution of CPU and GPU tasks, maximizing overall system utilization.
Here's a basic example of a CUDA kernel that adds two vectors:
__global__ void vectorAdd(float *a, float *b, float *c, int n) {
    int i = blockDim.x * blockIdx.x + threadIdx.x;
    if (i < n) {
        c[i] = a[i] + b[i];
    }
}
int main() {
    int n = 1000000;
    size_t size = n * sizeof(float);
    float *h_a, *h_b, *h_c;
    float *d_a, *d_b, *d_c;
    // Allocate host memory
    h_a = (float *)malloc(size);
    h_b = (float *)malloc(size);
    h_c = (float *)malloc(size);
    // Allocate device memory
    cudaMalloc(&d_a, size);
    cudaMalloc(&d_b, size);
    cudaMalloc(&d_c, size);
    // Initialize host arrays and copy to device
    for (int i = 0; i < n; i++) {
        h_a[i] = rand() / (float)RAND_MAX;
        h_b[i] = rand() / (float)RAND_MAX;
    }
    cudaMemcpy(d_a, h_a, size, cudaMemcpyHostToDevice);
    cudaMemcpy(d_b, h_b, size, cudaMemcpyHostToDevice);
    // Launch kernel
    int threadsPerBlock = 256;
    int blocksPerGrid = (n + threadsPerBlock - 1) / threadsPerBlock;
    vectorAdd<<<blocksPerGrid, threadsPerBlock>>>(d_a, d_b, d_c, n);
    // Copy result back to host
    cudaMemcpy(h_c, d_c, size, cudaMemcpyDeviceToHost);
    // Clean up
    cudaFree(d_a); cudaFree(d_b); cudaFree(d_c);
    free(h_a); free(h_b); free(h_c);
    return 0;
}
This example demonstrates key CUDA concepts such as kernel definition, memory allocation on both host and device, data transfer between CPU and GPU, and kernel launch configuration.
Streamlining the Data Pipeline: Feeding Your GPU Efficiently
An optimized data pipeline is crucial for maximizing GPU utilization in model training. Efficient data handling ensures that the GPU is consistently fed with data, minimizing idle time and maximizing computational throughput. A well-designed pipeline can significantly reduce training time and improve overall model performance.
Data Preprocessing
Data preprocessing and augmentation on the CPU play a vital role in preparing data for GPU consumption. These techniques include:
Normalization: Scaling input data to a standard range (e.g., 0-1 or -1 to 1) to improve model convergence.
Encoding: Converting categorical variables into numerical representations (e.g., one-hot encoding, label encoding).
Augmentation: Applying transformations like rotation, flipping, or color jittering to increase dataset diversity and prevent overfitting.
Filtering: Removing irrelevant or corrupted data points to improve training quality.
Performing these operations on the CPU allows for parallel processing with GPU computations, reducing overall training time.
Efficient Data Loading
Efficient data loading and transfer to GPU memory are essential for maintaining high GPU utilization. Key methods include:
Prefetching: Loading the next batch of data while the GPU processes the current batch.
Pinned memory: Using non-pageable memory to accelerate host-to-device transfers.
Asynchronous data transfer: Overlapping data transfer with GPU computations.
Data sharding: Distributing data across multiple GPUs for parallel processing in multi-GPU setups.
Data Pipeline Optimization Practices
Best practices for data pipeline optimization include:
Use asynchronous data loading to overlap I/O operations with GPU computations
Implement efficient data formats (e.g., TFRecord, WebDataset) to reduce I/O overhead
Utilize CPU multiprocessing for data preprocessing and augmentation
Optimize batch size to balance between GPU utilization and memory constraints
Employ mixed-precision training to reduce memory usage and increase throughput
Monitor and profile your data pipeline to identify bottlenecks
Cache frequently used datasets in RAM or SSD for faster access
Leverage distributed data loading for multi-GPU and multi-node training setups
Batching Strategies: Finding the Sweet Spot
Batch size refers to the number of training samples processed in a single iteration before the model's parameters are updated. It plays a crucial role in GPU utilization, affecting both training speed and model performance.
Relation of Batch Sizes with GPU Performance
Large Batches - They generally lead to better GPU utilization by increasing parallelism and reducing the overhead of parameter updates. There is more GPU utilization. However, they may also require more memory and can potentially impact model generalization.
Small Batch Sizes - Lead to underutilized GPUs, reducing parallelism. The GPU processes fewer samples which leads to idle time. However, it is less straining for the memory than in the case of larger batches.
Determining the optimal batch size involves balancing several factors:
GPU Memory Capacity: The maximum batch size is often limited by the available GPU memory.
Computational Efficiency: Larger batches typically result in higher throughput due to increased parallelism.
Convergence Rate: Smaller batches can lead to faster initial convergence but may result in noisier gradients.
Generalization Performance: Very large batch sizes may negatively impact the model's ability to generalize to unseen data.
Advanced Batching Strategies
Advanced batching strategies help to overcome limitations and further optimize GPU utilization:
Gradient Accumulation: Simulate larger batch sizes by accumulating gradients over multiple smaller batches before updating model parameters. This technique allows for effective larger batch sizes without exceeding GPU memory constraints.
Dynamic Batching: Adjust the batch size during training based on various factors such as gradient statistics, model performance, or available computational resources. This approach can adapt to changing requirements throughout the training process.
Mixed-Precision Training: Utilize lower precision (e.g., FP16) for certain operations, allowing for larger batch sizes within the same memory constraints.
Micro-Batching: Process large logical batches as a series of smaller micro-batches, reducing memory requirements while maintaining the statistical benefits of large batch training.
Layer-wise Adaptive Rate Scaling (LARS): Adjust learning rates for each layer based on the ratio of parameter norms to gradient norms, enabling stable training with very large batch sizes.
Batch Size | Pros | Cons |
Small (e.g., 16-64) |
|
|
Medium (e.g., 128-512) |
|
|
Large (e.g., 1024+) |
|
|
The optimal batch size depends on the specific task, model architecture, available hardware, and desired trade-offs between training speed, memory usage, and model performance.
Mixed Precision Training: Balancing Accuracy and Speed
Mixed precision training is an advanced technique in deep learning that combines different numerical precisions in a single model. This approach typically uses a mix of 32-bit single-precision (FP32) and 16-bit half-precision (FP16) floating-point formats during the training process.
The core idea is to leverage the speed and memory benefits of lower precision computations while maintaining the numerical stability and accuracy of higher precision operations.
Using lower precision formats like FP16 in certain operations offers several benefits:
Reduced memory usage: FP16 requires half the memory of FP32, allowing for larger batch sizes or more complex models.
Faster computation: Many modern GPUs, especially those designed for deep learning, have specialized hardware for FP16 arithmetic, offering significant speedups.
Lower power consumption: Reduced memory bandwidth and simpler computations lead to energy savings.
Faster data transfer: Smaller data sizes result in quicker I/O operations and reduced communication overhead in distributed training.
However, training entirely in FP16 can lead to numerical instability and loss of accuracy. To maintain model accuracy while leveraging the benefits of mixed precision, several techniques are employed:
Loss scaling: To prevent gradients from becoming too small for FP16 representation, the loss is scaled up before backpropagation and gradients are scaled down before updates.
Master weights in FP32: While FP16 is used for storage and computation, the master copy of weights is kept in FP32 for accurate updates.
Dynamic loss scaling: Automatically adjusting the loss scale factor to prevent gradient underflow or overflow.
Selective precision: Using FP32 for critical operations that are sensitive to numerical precision.
Here's a code snippet demonstrating how to enable mixed precision training using PyTorch's automatic mixed precision (AMP) feature:
import torch
from torch.cuda.amp import autocast, GradScaler
# Define model, optimizer, and loss function
model = YourModel().cuda()
optimizer = torch.optim.Adam(model.parameters())
criterion = torch.nn.CrossEntropyLoss()
# Initialize the GradScaler
scaler = GradScaler()
# Training loop
for epoch in range(num_epochs):
    for inputs, labels in dataloader:
        inputs, labels = inputs.cuda(), labels.cuda()
        # Runs the forward pass with autocasting
        with autocast():
            outputs = model(inputs)
            loss = criterion(outputs, labels)
        # Scales loss and calls backward() to create scaled gradients
        scaler.scale(loss).backward()
        # Unscales gradients and calls optimizer.step()
        scaler.step(optimizer)
        # Updates the scale for next iteration
        scaler.update()
        optimizer.zero_grad()
# Don't forget to save the scaler state if you save model checkpoints
torch.save({
    'model': model.state_dict(),
    'optimizer': optimizer.state_dict(),
    'scaler': scaler.state_dict(),
}, 'checkpoint.pth')
This code demonstrates the use of PyTorch's autocast and GradScaler to implement mixed precision training. The autocast context manager automatically casts operations to FP16 where appropriate, while GradScaler handles loss scaling to prevent gradient underflow. By integrating these tools, developers can easily leverage mixed precision training to accelerate their deep learning workflows while maintaining model accuracy.
Suggested Reading: Unsupervised vs Supervised Learning: A Comprehensive Comparison
Mastering Memory: Strategies for Optimal GPU RAM Usage
As model complexity and dataset sizes continue to grow, optimizing GPU memory usage becomes increasingly important to prevent out-of-memory errors and ensure smooth training processes.
Reducing memory footprint is a key strategy for optimal GPU RAM usage. Gradient checkpointing is a powerful technique that trades computation for memory by selectively storing activations during the forward pass and recomputing them during backpropagation.
This approach can significantly reduce memory requirements, especially for deep networks with many layers. Another effective method is mixed precision training, which uses lower precision formats (e.g., FP16) for certain operations, effectively halving memory usage for those computations.
Techniques such as memory pooling, where a pre-allocated pool of memory is reused for different tensors, can reduce the overhead of frequent allocations and deallocations. Just-in-time (JIT) compilation can also optimize memory usage by generating efficient code that minimizes unnecessary allocations.
Several model architectures have been designed with memory efficiency in mind. For example:
EfficientNet: Utilizes compound scaling to balance network depth, width, and resolution, achieving state-of-the-art accuracy with reduced parameter count.
MobileNet: Employs depthwise separable convolutions to minimize computational and memory requirements while maintaining performance.
DistilBERT: A distilled version of BERT that retains most of its language understanding capabilities with significantly fewer parameters.
How to Optimize Memory for Maximized GPU Utilization
Here are some useful memory optimization tips for GPU utilization:
Use tensor operations that work in place when possible
Implement gradient accumulation for larger effective batch sizes
Leverage model parallelism to distribute memory load across multiple GPUs
Employ activation checkpointing strategically in very deep networks
Implement dynamic graph construction to allocate memory only when needed
Use memory-efficient optimizers like Adam with reduced memory states
Consider quantization techniques for both training and inference
Implement data-loading pipelines that prefetch and preprocess efficiently
Tackling Out-of-Memory Errors: Solutions and Workarounds
Out-of-memory (OOM) errors are a common challenge in GPU training, especially when working with large models or datasets. These errors occur when the GPU's memory capacity is exceeded, halting the training process. Common causes of OOM errors include:
Oversized model architecture: Models with too many parameters for the available GPU memory.
Large batch sizes: Attempting to process more data than the GPU can handle simultaneously.
Inefficient memory management: Accumulation of unused tensors or improper memory deallocation.
High-resolution input data: Processing large images or long sequences that consume excessive memory.
Memory fragmentation: Inefficient allocation leads to unusable gaps in GPU memory.
Diagnosing memory issues requires a systematic approach:
Use GPU monitoring tools (e.g., nvidia-smi, gpustat) to track memory usage in real-time.
Implement memory profiling within your code using framework-specific tools (e.g., torch.cuda.memory_summary() for PyTorch).
Analyze memory consumption at different stages of your training pipeline.
Identify memory peaks and potential memory leaks by tracking tensor allocations and deallocations.
Strategies for overcoming memory limitations include:
Model sharding: Distribute model parameters across multiple GPUs or devices.
CPU offloading: Temporarily move less frequently accessed data to CPU memory.
Gradient accumulation: Simulate larger batch sizes by accumulating gradients over multiple smaller batches.
Mixed precision training: Utilize lower precision (e.g., FP16) to reduce memory footprint.
Activation checkpointing: Trade computation for memory by recomputing activations during backpropagation.
Dynamic graph construction: Build the computational graph on the fly to optimize memory usage.
Memory-efficient architectures: Employ models designed for low memory consumption (e.g., EfficientNet, MobileNet).
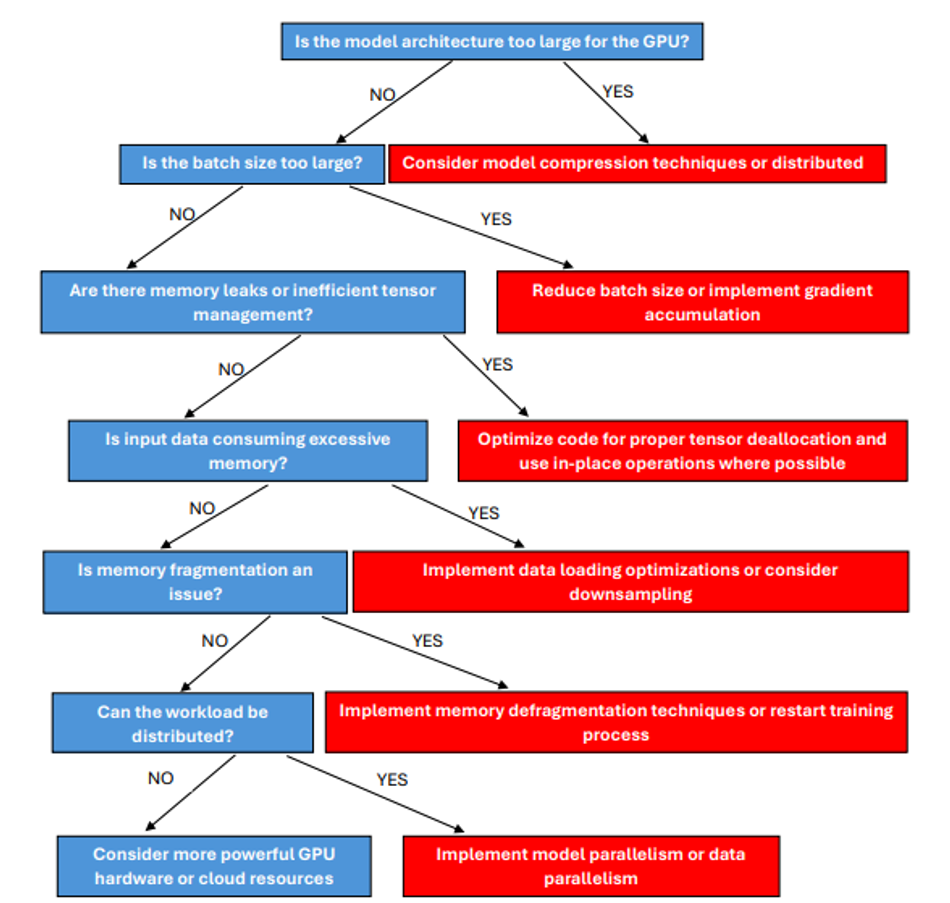
The following decision tree shows the flow for troubleshooting memory issues:
By systematically addressing these aspects, developers can effectively tackle out-of-memory errors and optimize GPU utilization for large-scale deep-learning tasks.
Keeping an Eye on Performance: Monitoring and Profiling GPU Usage
Monitoring GPU utilization during training is crucial for optimizing performance, identifying bottlenecks, and ensuring efficient resource allocation. Continuous monitoring allows developers to detect issues such as underutilization, memory leaks, or thermal throttling, which can significantly impact training speed and model convergence.
Popular tools for GPU monitoring include:
NVIDIA-SMI(NVIDIA System Management Interface): A command-line utility that provides real-time information about GPU usage, memory consumption, and temperature.
gpustat: A more user-friendly alternative to Nvidia-smi, offering a concise summary of GPU statistics.
NVIDIA-Docker stats: For containerized environments, this tool provides GPU metrics for Docker containers.
PyTorch and TensorFlow built-in functions: Both frameworks offer native functions to query GPU status programmatically.
Advanced profiling techniques using NVIDIA Nsight Systems provide deeper insights into GPU performance:
Timeline view: Visualizes GPU and CPU activities over time, helping identify synchronization issues and idle periods.
CUDA kernel analysis: Examines individual CUDA kernel executions, revealing performance bottlenecks at the operation level.
Memory analysis: Tracks memory allocations and transfers, crucial for optimizing data movement between CPU and GPU.
Multi-GPU profiling: Analyzes performance across multiple GPUs in distributed training setups.
Key metrics to track for optimal GPU utilization include:
GPU Utilization: Percentage of time the GPU is actively computing.
Memory Usage: Current and peak memory consumption.
PCIe Throughput: Data transfer rate between CPU and GPU.
SM (Streaming Multiprocessor) Occupancy: Efficiency of thread block scheduling.
Cache Hit Rate: Effectiveness of L1 and L2 cache usage.
Power Consumption: GPU power draw, which can indicate efficiency.
Temperature: GPU core temperature, is important for sustained performance.
Tool | Real-time Monitoring | Profiling Depth | Ease of Use | Multi-GPU Support | Visualization |
nvidia-smi | Yes | Low | High | Yes | Text-based |
gpustat | Yes | Low | High | Yes | Text-based |
NVIDIA-Docker stats | Yes | Low | Medium | Yes | Text-based |
PyTorch/TensorFlow functions | Yes | Medium | Medium | Yes | Customizable |
NVIDIA Nsight Systems | No | Very High | Low | Yes | Advanced GUI |
By leveraging these tools and focusing on key metrics, developers can gain comprehensive insights into GPU performance, enabling data-driven optimizations and ensuring maximum utilization of GPU resources throughout the training process.
Interpreting Profiling Data: Identifying and Resolving Bottlenecks
GPU profiling data provides crucial insights into the performance characteristics of deep learning workloads. To interpret this data effectively, focus on metrics such as GPU utilization, memory usage, kernel execution times, and data transfer rates.
Timeline views in profiling tools like NVIDIA Nsight Systems offer a visual representation of these metrics over time, allowing for the identification of performance bottlenecks and inefficiencies.
Common bottlenecks in GPU utilization and their signatures include:
Low GPU utilization: Indicated by long periods of idle time in the GPU timeline, often due to CPU-bound operations or inefficient data loading.
Memory thrashing: Characterized by frequent memory allocations and deallocations, leading to fragmentation and reduced performance.
PCIe bottlenecks: Visible as high PCIe transfer times relative to compute times, suggesting inefficient data movement between CPU and GPU.
Kernel launch overhead: Manifests as numerous small, quickly executing kernels with significant gaps between them.
Uncoalesced memory access: This is reflected in low memory bandwidth utilization and increased memory access latency.
Strategies for addressing identified bottlenecks:
For low GPU utilization:
Implement asynchronous data loading and preprocessing
Optimize CPU-bound operations or offload them to the GPU where possible
Increase batch size to provide more work for the GPU
To resolve memory thrashing:
Implement a memory pool to reduce allocation overhead
Reuse tensors instead of creating new ones for intermediate results
Use in-place operations where applicable
For PCIe bottlenecks:
Minimize data transfers between CPU and GPU
Use pinned memory for faster host-to-device transfers
Implement data prefetching to overlap computation with data transfer
To reduce kernel launch overhead:
Fuse multiple small operations into larger kernels
Utilize persistent kernels for repetitive operations
Employ CUDA graphs to reduce launch latency
For uncoalesced memory access:
Ensure proper memory alignment in data structures
Utilize shared memory for frequently accessed data
Optimize data layout to promote coalesced access patterns
Conclusion
Efficient GPU utilization is crucial for accelerating deep learning model training. This involves optimizing hardware, and software, and continuously monitoring performance. Strategies like efficient data pipeline management, proper batch sizing, parallel processing, mixed precision training, and memory optimization can significantly boost training speed and model performance.
In the dynamic world of deep learning, ongoing optimization is essential. Adapting GPU utilization techniques is crucial as models become more complex and datasets grow. Regularly profiling GPU performance and addressing bottlenecks will ensure efficient training. Experimenting with different optimization strategies will provide valuable insights into achieving optimal performance.
The field of GPU acceleration in AI is rapidly evolving. Emerging technologies like specialized AI accelerators, advanced memory architectures, and improved software frameworks will likely reshape how we utilize GPUs. Staying updated on these developments will be crucial for maintaining peak performance in AI model training.
Frequently Asked Questions
What is GPU utilization, and why is it important in model training?
GPU utilization refers to the percentage of GPU resources actively used during model training. High utilization is crucial for maximizing training speed and efficiency, ensuring that expensive GPU hardware is fully leveraged to accelerate deep learning tasks.
How can I monitor GPU utilization during training?
You can use tools like nvidia-smi, gpustat, or built-in functions in frameworks like PyTorch and TensorFlow to monitor GPU utilization. More advanced profiling can be done with NVIDIA Nsight Systems for detailed performance analysis.
What is mixed precision training, and how does it improve GPU utilization?
Mixed precision training uses a combination of 32-bit and 16-bit floating-point formats. It improves GPU utilization by reducing memory usage and increasing computational throughput, often leading to faster training times without sacrificing model accuracy.
How does batch size affect GPU utilization?
Batch size directly impacts GPU utilization. Larger batch sizes generally lead to higher GPU utilization by providing more data for parallel processing. However, there's a trade-off with memory consumption and potentially diminishing returns on model convergence.
What are some common causes of low GPU utilization during training?
Common causes include inefficient data loading, CPU bottlenecks, small batch sizes, unoptimized model architecture, and excessive CPU-GPU data transfers. Identifying and addressing these issues can significantly improve utilization.
How can I troubleshoot out-of-memory errors when training large models?
To troubleshoot out-of-memory errors, try reducing batch size, implementing gradient accumulation, using mixed precision training, employing model parallelism, or utilizing techniques like activation checkpointing to reduce memory footprint.
What's the difference between data parallelism and model parallelism?
Data parallelism distributes batches of data across multiple GPUs, with each GPU having a full copy of the model. Model parallelism splits the model itself across multiple GPUs, with each GPU responsible for a portion of the model's computations. The choice depends on model size and available GPU memory.

