Battery Degradation: Mechanisms, Causes, and How to Slow It
Explore battery degradation in lithium-ion cells, from SEI growth and lithium plating to SOH, fleet data, and life-extension strategies.

18 Aug, 2026. 16 minutes read
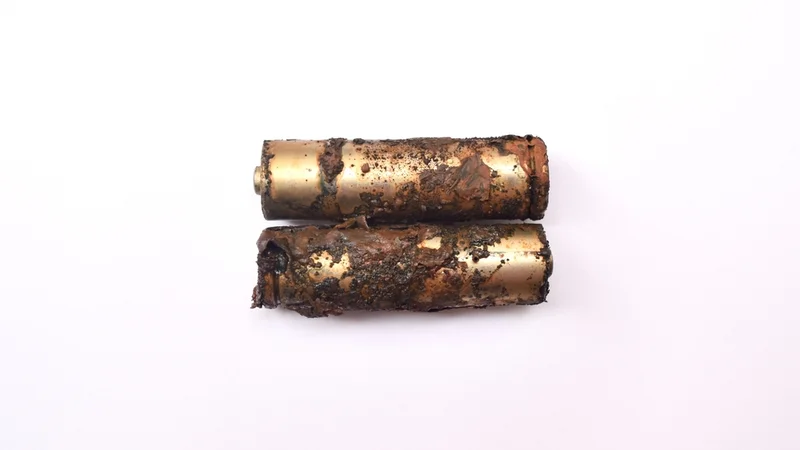
Corroded and Degraded AA Batteries
Key Takeaways
Measurable Degradation Mechanisms – Battery degradation surfaces as two measurable effects, capacity loss and internal resistance growth, which trace back to three underlying modes: loss of lithium inventory, loss of active material, and impedance growth.
Anode Failure Pathways – Solid electrolyte interphase growth on the anode is the predominant source of lithium loss during storage, whereas lithium plating and particle cracking dominate under fast charging and low temperatures.
Real-World Fleet Data – Fleet data from over 22,700 electric vehicles shows average degradation at 2.3% per year, ranging from roughly 1.5% per year for vehicles that rarely DC fast charge to 3.0% per year for heavy, high-power fast charging.
Stress Factor Optimization – Temperature and state-of-charge window are the two levers with the largest measured effect; narrow, mid-range SOC cycling at moderate temperatures reliably slows capacity fade.
Non-Linear Knee Occurrence – Degradation is not always linear; a cell can maintain a stable trajectory for hundreds of charge cycles and then hit a knee point, after which capacity falls sharply.
Introduction
Every rechargeable cell you design into a product starts dying the moment it is manufactured. Battery degradation is not a defect; it is the sum of side reactions and mechanical damage that run alongside the reversible chemistry you actually want. The engineering question is never whether a battery degrades. It is how fast, what drives it, and whether your operating envelope pushes the cell toward a slow linear decline or a sudden collapse.
This matters across scales. Electric vehicles need traction packs that hold up for 8 to 10 years across wide temperature and load ranges, while grid energy storage systems are underwritten for more than 20 years, so a fraction of a percent per year compounds into a very different asset. This guide covers the chemistry driving battery degradation, the operating conditions that accelerate it, how engineers measure it, and the design decisions that extend service life.
What Battery Degradation Actually Means?
Battery degradation does not appear as a single loss in performance. In practice, two different characteristics deteriorate over time, and they do not necessarily decline at the same rate.
1. Capacity Fade: The gradual reduction in the amount of charge a battery can store and deliver. For example, a cell originally rated at 100 Ah that can now provide only 85 Ah has lost 15% of its usable capacity.
2. Power Fade: The rise in internal resistance. The cell may still hold charge, but voltage sags harder under load, usable energy at high current drops, and more of your energy turns into heat. This matters most in applications that require rapid acceleration, fast charging, or other high-power operation.
State of Health and End of Life
State of Health (SOH) is the single number a battery management system reports to quantify degradation. The capacity-based definition is straightforward:
SOH = (Present Usable Capacity / Rated Capacity) × 100%
The resistance-based definition exists in parallel, tracking internal resistance growth against the beginning-of-life value. Power-limited applications care more about the second than the first.
Convention places the end of first life somewhere in the 70% to 80% SOH band. [1] For EV traction packs and grid energy storage systems, 80% SOH is the usual contractual threshold, which is why a warranty is effectively a promise about the fade-curve shape.
Recommended Reading: The Pivotal Role of Battery Management Systems on the Performance of Electric Vehicles
The Three Degradation Modes
Dozens of chemical reactions cause degradation, but at the cell terminals they collapse into three observable modes. Understanding these modes provides a more useful diagnostic framework than focusing on individual side reactions alone.
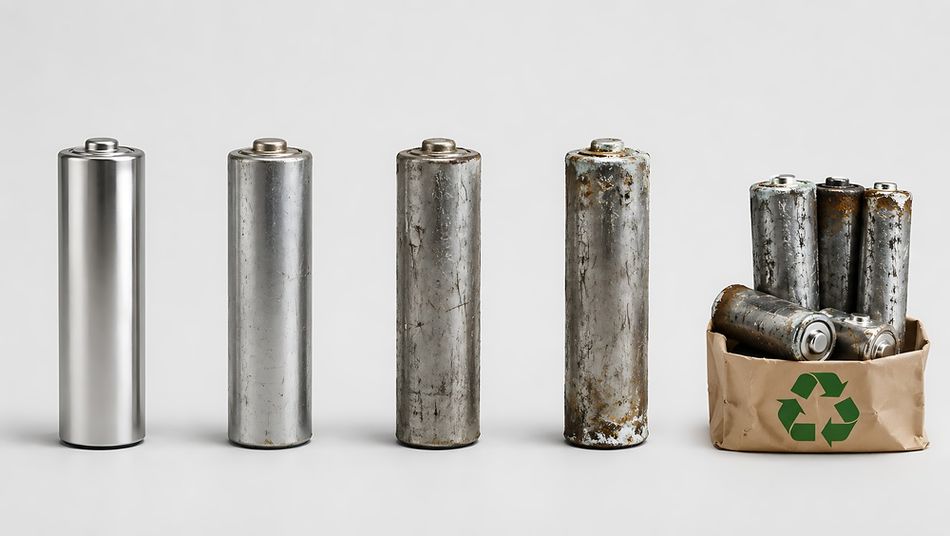
Loss of Lithium Inventory (LLI) occurs when cyclable lithium is permanently consumed by unwanted side reactions, such as continued solid-electrolyte interphase formation or lithium plating. With less lithium available to shuttle between the electrodes, the cell gradually loses usable capacity. LLI can also shift the relative operating windows of the electrodes, producing characteristic electrode slippage in the voltage profile.
Loss of Active Material (LAM) occurs when portions of the positive or negative electrode can no longer participate effectively in the electrochemical reaction. Particle cracking, structural damage, loss of electrical contact, and electrode dissolution can all contribute to this process. Like LLI, LAM causes capacity fade, but it often changes the shape and features of the voltage curve of a cell in a different way.
Impedance Growth, the third mode, does not necessarily remove lithium or active electrode material. Instead, it makes charge and ion transport increasingly difficult. Rising resistance causes greater voltage sag under load, reduced power capability, increased heat generation, and lower charging efficiency.
LLI and LAM both reduce capacity, but they leave different fingerprints on the voltage curve, which this article exploits later through differential analysis.
Degradation Mechanisms Inside a Lithium-Ion Cell
Five mechanisms account for most of the damage in lithium-ion batteries under normal operation. They interact, so isolating a single root cause from terminal measurements alone is rarely possible.
SEI Growth on the Anode
The solid electrolyte interphase is a passivation layer that forms on the graphite anode when the electrolyte is reduced at potentials below its stability window. It is necessary: without it, the electrolyte would decompose continuously.
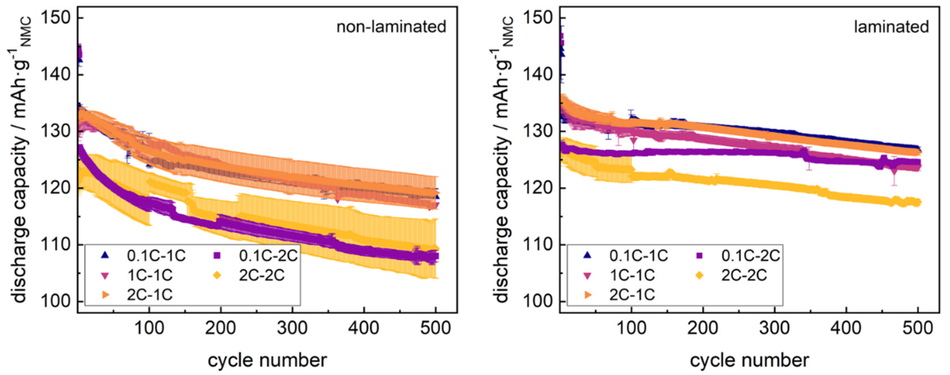
The layer forms from lithium carbonate (Li2CO3), lithium alkyl carbonates, and fluorinated species, including LiF, formed when fluoride from HF and PF5 reacts with lithium. [2] Those reaction products are electronically insulating and, when non-uniform, unstable. Every lithium ion locked into the SEI can no longer shuttle. SEI formation is the predominant source of lithium ion loss during storage conditions, which makes it the main driver of calendar aging.
The layer thickens as decomposition continues, and it cracks as the graphite lattice expands and contracts during lithium insertion and removal. Fresh surface is exposed, and the reaction restarts. Because the layer impedes the very reaction that grows it, fade from this mechanism decelerates over time, so lifetime models fit it with a sub-linear time exponent rather than a straight line.
Lithium Plating
Once the anode potential drops below 0 V against Li/Li+, lithium ions deposit as metal on the anode surface instead of intercalating into the graphite. This is lithium plating, the single most damaging mechanism in normal operation.
Plating is driven by anything that makes intercalation too slow to keep up with the current:
Low Temperatures: Charging at around -20 °C combined with high charging rates initiates plating. [2]
High C-Rate Charging: Interfacial current density exceeds what solid-state diffusion into graphite can absorb.
Cell Design: The low anode-to-cathode capacity ratio polarizes the anode toward lithium deposition potentials.
Electrolyte Formulation: High ethylene carbonate content shows greater plating propensity.
Plated lithium is doubly harmful. Some reacts with the electrolyte to form more SEI and is permanently lost, and some grows into dendrites that can eventually bridge the separator. It is easily detectable; plating leaves a voltage plateau on the discharge profile and depresses coulombic efficiency.
Cathode Degradation and Transition Metal Dissolution
The cathode degrades through a different route. Transition metals dissolve out of the oxide lattice, migrate through the electrolyte, and deposit on the anode, where they catalyse further SEI growth.
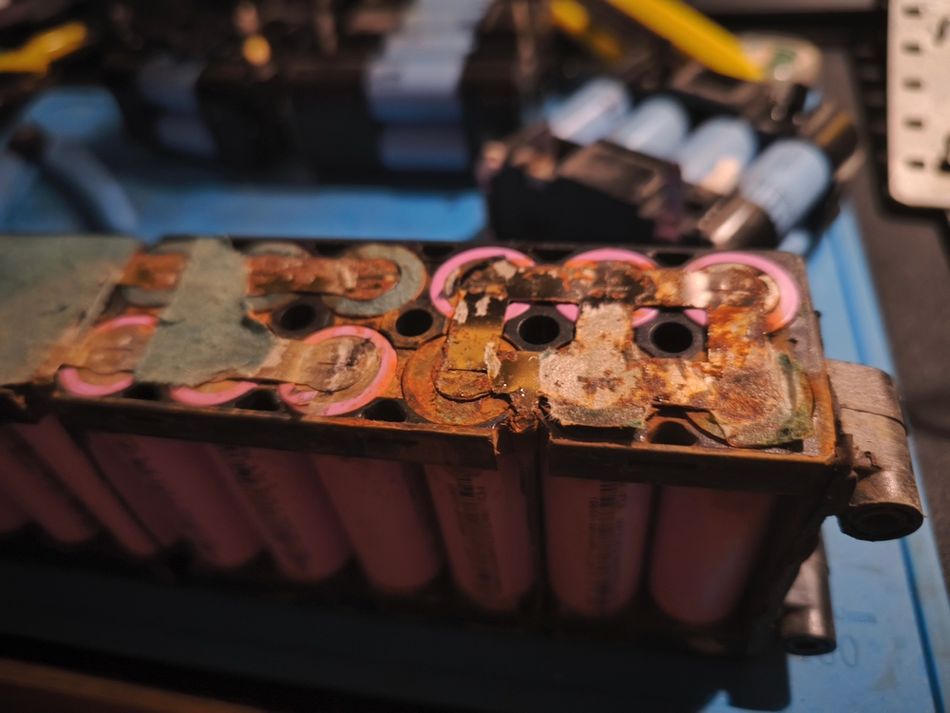
The magnitudes are small in absolute terms and severe in effect. In NMC811 and graphite cells cycled 120 times at 60 °C with a 4.6 V upper cutoff, researchers measured 6.1 µg/cm² of nickel, 0.62 µg/cm² of manganese, and 0.3 µg/cm² of cobalt deposited on the anode. [3] At room temperature and 4.2 V, even after twice the cycle count (240 cycles), deposits fell to 1.0, 0.2, and 0.1 µg/cm², respectively.
The capacity consequences track the same pattern:
| Condition | Condition | Formation Loss | Aging Loss | Total Loss |
| Room Temperature, 4.2 V cutoff | 120 | 41.0 mAh/g | 55.4 mAh/g | 96.5 mAh/g (35% of Theoretical) |
| 60 °C, 4.6 V cutoff | 120 | 128.0 mAh/g | 57.5 mAh/g | 185.5 mAh/g (67% of Theoretical) |
The lesson for pack design is direct. Raising the upper cutoff voltage buys you datasheet energy density but costs you disproportionately in battery lifespan, and combining a high cutoff with high temperatures is the worst case.
Mechanical Stress and Particle Cracking
Electrode particles expand and contract on every cycle. Graphite moves a few percent, silicon-containing anodes move far more, with silicon expanding roughly 300% at full lithiation. [4]
That strain fractures particles. High charging rates and elevated state of charge drive cracking, fissures, and splitting in graphite. [1] Cracked particles either lose electrical contact with the conductive network (a loss of active material) or expose fresh surfaces that immediately grow new SEI (a loss of lithium inventory).
The particle size is a genuine design trade-off. Smaller particles shorten diffusion paths and improve rate capability, but their larger total surface area produces higher irreversible capacity loss during formation.
Electrolyte and Additive Depletion
Electrolyte is consumed, not just displaced. Solvent goes into SEI formation, and additives are sacrificial by design.
Fluoroethylene Carbonate, the standard additive for silicon-containing anodes, is consumed on silicon at roughly ten times the rate seen on graphite, a direct consequence of silicon's volume change. [4] Once the additive is exhausted, the protective film stops being replenished and degradation accelerates sharply.
Recommended Reading: How to Charge a Lithium-Ion Battery Safely and Efficiently?
Calendar Aging Versus Cycle Aging
Battery degradation splits into two components that you can measure and model independently.
| Factor | Calendar Aging | Cycle Aging |
| Driver | Time at Temperature and State of Charge | Charge and Discharge Throughput |
| Dominant Mechanism | SEI Growth, Electrolyte Decomposition | Lithium Plating, Particle Cracking, SEI Cracking and Regrowth |
| Main Controls | Storage SOC, Temperature | Charging Rate, SOC Window, Temperature |
| Applies Most To | Backup Power, Seasonal Assets, Vehicles Parked at High SOC | Daily-Cycled Energy Storage Systems, High-Utilisation Fleets |
Both run at once. The vehicle parked for a week at 100% SOC in summer heat is accruing calendar aging even though it never left the driveway.
What Actually Drives the Rate?
A multi-condition study on 2 Ah LFP pouch cells with graphite anodes tested storage SOC, temperature, mechanical preload, charging rate, discharge rate, and SOC window against both aging types. [5]
Temperature
Elevated temperature accelerates capacity loss consistently, because thermally enhanced side-reaction kinetics dominate over the polarization reduction you get from better transport. High temperatures speed up every parasitic chemical reaction in the cell simultaneously.
Temperature extremes cut both ways, though, but through different mechanisms. In cycle aging tests, high-rate charging at 25 °C induced lithium plating and rapid capacity loss, while at 45 to 60 °C the improved transport actually suppressed plating, only to accelerate SEI-driven fade instead.
That is the core thermal management trade-off: you choose which mechanism to feed, not eliminate degradation.
State of Charge and Depth of Discharge
Higher storage SOC accelerates calendar aging through intensified SEI growth. For cycle aging, wider SOC windows and higher maximum SOC significantly accelerate fade and irreversible cell expansion, while narrower mid-range windows measurably mitigate both.
Depth of Discharge is the cycling expression of the same effect. Shallow cycles in a mid-range band cost far less battery health per unit of energy delivered than full-depth cycles, which is why cycle-life figures are only meaningful when quoted alongside the depth of discharge at which they were measured.
One counterintuitive result deserves attention. Once cells were aged to the same SOH under different storage SOC conditions, the largest increase in DC resistance appeared in cells stored at 50% SOC, not at the highest SOC. Impedance growth does not scale directly with SEI formation, so a cell with good capacity retention can still have degraded power capability.
Independent modelling work on 62 automotive cells aged under 28 protocols found the operating window, meaning maximum and minimum state of charge, had the largest impact on SEI growth of any factor tested. [6]
Charging Rates and C-Rate
Charging current matters far more than discharge current. In the LFP study, cycle aging was governed by charging rate, SOC window, and temperature, while discharge rate had only a minor effect. Slower discharges sometimes produced more degradation, simply because the cell spent longer at temperature.
There is a nuance worth resolving. The SEI modelling study found applied current almost negligible for SEI growth specifically, while the LFP cycling study found charging rate dominant for total cycle aging. Both are correct: current has little influence on the SEI pathway, but it becomes the controlling variable the moment C-rate is high enough to push the anode into plating.
Practically, this means a moderate C-rate increase is cheap, and a C-rate that crosses the plating threshold is very expensive.
Mechanical Preload
Mechanical preload had little effect on capacity fade or DC resistance growth in the LFP tests, though it amplified measured stress signals as ageing progressed. Preload is primarily a mechanical design parameter for these cells rather than an electrochemical one.
Stress Factor Summary
The strongest drivers of battery degradation are generally temperature, charging rate, state of charge, and voltage limits. High temperatures accelerate parasitic reactions and SEI growth, while charging at low temperatures or high C-rates can promote lithium plating. Operating across wide or consistently high SOC ranges increases capacity fade and irreversible expansion, while prolonged storage at high SOC accelerates calendar aging. Similarly, high upper cutoff voltages can increase cathode degradation, transition-metal dissolution, and structural changes. In comparison, discharge C-rate and mechanical preload usually have lower direct influence on electrochemical aging under normal operating conditions, although their importance can increase under extreme mechanical or thermal conditions.
Recommended Reading: Enhancing Battery Health with Machine Learning
Nonlinear Aging and the Knee Problem
Fade curves are not reliably linear, and this failure mode catches teams out. The cell tracks a predictable trajectory, then bends into a steep decline. That bend is a knee, formally the point of maximum curvature in the capacity trajectory. [4]
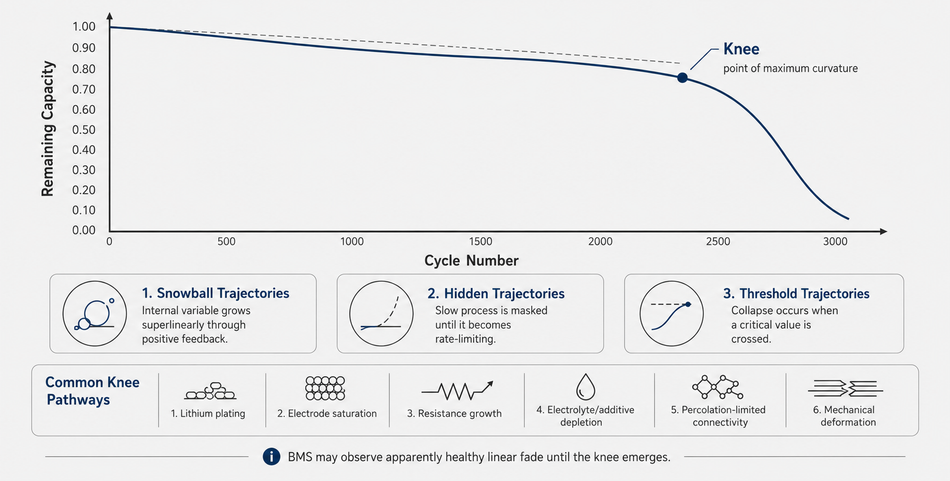
Knees arise from three classes of internal state trajectories:
Snowball Trajectories: Internal variable grows superlinearly through positive feedback, directly driving observable degradation.
Hidden Trajectories: Slow degradation process is masked by a faster one and stays undetectable until it becomes rate-limiting.
Threshold Trajectories: Performance collapses when an internal variable crosses a critical value.
6 pathways produce them: lithium plating, electrode saturation, resistance growth, electrolyte and additive depletion, percolation-limited connectivity, and mechanical deformation.
The engineering problem is that several of these have internal state trajectories with signals that are electrochemically undetectable from the outside. Your BMS may see a healthy, linear fade curve right up until the knee. Different offline detection methods (Kneedle, Bacon-Watts, tangent-ratio, bisector, and quantile regression) typically agree within about 26 cycles, which is precise enough for post-hoc analysis and far too late for prevention.
Chemistry Matters: LFP and NMC
Battery chemistry sets the baseline before any operating strategy:
LFP (Lithium Iron Phosphate) offers strong cycling stability, low cost, and high safety margin, which is why it dominates stationary energy storage systems and increasingly appears in standard-range EVs. [5] Its flat voltage curve is a diagnostic liability, though: it makes SOC estimation harder and weakens the voltage-based signals used for SOH tracking.
NMC (Nickel Manganese Cobalt) delivers higher energy density, which buys range and pack-level mass savings. The cost is a cathode that is more sensitive to voltage and thermal stress, with transition metal dissolution rising steeply at elevated cutoffs and temperatures.
There is none better, universally. If your duty cycle is daily deep cycling in a fixed installation where mass doesn't matter, LFP's cycle-life advantage compounds. If you are constrained by mass or volume, NMC's energy density advantage may be worth the tighter thermal and voltage management it demands.
Recommended Reading: What Is LiFePO4? Engineering Guide to Lithium Iron Phosphate Batteries
Real-World Degradation Data
Laboratory aging tests isolate individual stress factors, but fleet data shows how battery degradation develops when temperature, charging behaviour, utilisation, and driving conditions interact in real service.The analysis of more than 22,700 electric vehicles across 21 models reported an average 2.3% annual degradation rate, corresponding to approximately 81.6% remaining capacity after eight years. [7]
Charging behaviour produced some of the largest differences. Vehicles using DC fast charging for less than 12% of charging sessions degraded by around 1.5% per year, retaining roughly 88% capacity after eight years. High-frequency, low-power DC fast charging increased degradation to about 2.2% annually, while vehicles frequently using chargers above 100 kW reached approximately 3.0% per year, implying around 76% remaining capacity after eight years.
The vehicle duty cycle also mattered. Light passenger cars averaged about 2.0% degradation annually, compared with 2.7% for vans and multi-purpose vehicles. Hot climates added roughly 0.4 percentage points compared with milder environments.
The data reinforces a practical conclusion: fast-charging frequency, high utilisation, and thermal exposure can materially influence long-term battery health, often more than differences between individual vehicle platforms.
How Battery Degradation Is Measured?

Capacity Testing
The reference method is a full controlled discharge at a defined C-rate and temperature, comparing delivered capacity against rating. It is accurate and slow, and it takes the asset offline, so it is a laboratory and commissioning tool rather than a continuous one.
Coulomb Counting
Integrating current over time gives a running capacity estimate. It is cheap and always available to the BMS, and it drifts because sensor offset accumulates without an absolute reference. The production systems correct it against open-circuit voltage at rest.
Incremental Capacity and Differential Voltage Analysis
Incremental capacity analysis computes dQ/dV during a slow constant-current charge or discharge. Phase transitions in the electrode materials appear as peaks, and as cells age, those peaks shift and change height in ways that map onto specific degradation modes. [1]
Differential Voltage Analysis (dV/dQ) is the inverse view and separates anode and cathode contributions particularly well. Together, these techniques do what a capacity test cannot: they tell you which mode is causing the fade, distinguishing lithium inventory loss from active material loss. The constraint is that both need slow, low-current, wide-SOC sweeps, which many duty cycles never provide.
Electrochemical Impedance Spectroscopy
EIS applies a small AC excitation across a frequency sweep and resolves the cell into ohmic resistance, SEI resistance, and charge-transfer resistance. It is fast and non-invasive, and it directly measures the impedance growth mode that capacity tests miss entirely. Onboard implementation costs additional hardware, which is why it remains more common in test labs than in production packs.
Model-Based Estimation
Modern approaches fit health indicators to data-driven models. Combining incremental capacity features with differential thermal voltammetry and differential temperature signals, a bidirectional LSTM achieved SOH estimation errors below 1.2% RMSE and 1% MAE on the NASA and Oxford datasets, with a best case of 0.47% RMSE over 168 cycles. [1]
Physics-based models remain valuable where you need extrapolation rather than interpolation. The four-parameter SEI growth model validated against 62 automotive cells aged under 28 different protocols reached 1.28% RMSE. [6]
Standardised Testing
For comparable results, use a standard. IEC 62660-1:2018 (Edition 2.0, published 12 December 2018) specifies performance and life testing of secondary lithium-ion cells for propulsion of electric vehicles, covering both BEV and HEV applications. [8] It defines procedures for capacity, power density, energy density, storage life, and cycle life, which gives you a defensible basis for comparing cells from different suppliers.
Designing to Slow Battery Degradation
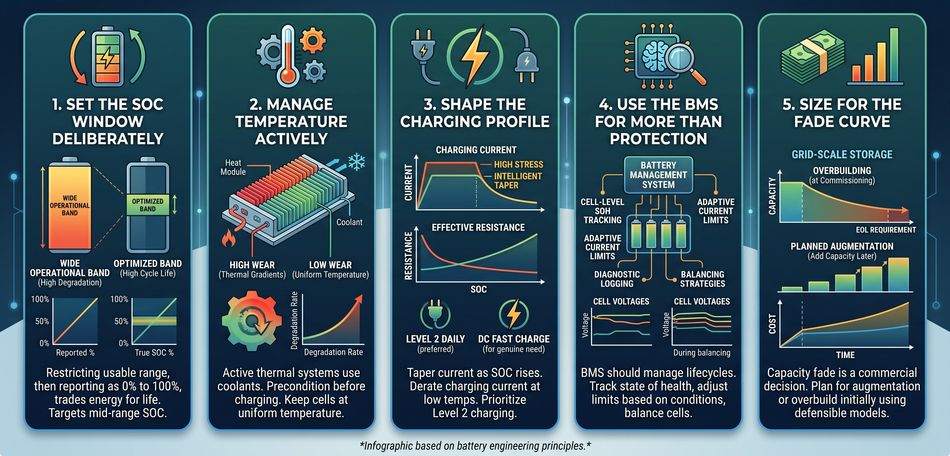
Set the SOC Window Deliberately
This is the highest-leverage software decision available. Restricting the usable window to a mid-range band, then reporting that band as 0% to 100% to the user, trades nameplate energy for cycle life. Given that wider and higher SOC ranges significantly accelerate fade, the trade is usually worth making for daily-cycled assets. For storage, target mid-range SOC rather than full. Vehicles and backup energy storage systems that sit at 100% for weeks accumulate avoidable calendar aging.
Manage Temperature Actively
Thermal management systems earn their cost and parasitic load. Keep cells away from high temperatures during rest and operation, and precondition before charging in cold conditions so that low temperatures never coincide with high charging rates. Uniformity matters as much as absolute temperature. The gradient across a module means battery cells age at different rates, and pack capacity is set by the worst cell.
Shape the Charging Profile
Taper current as SOC rises, because the plating margin shrinks as the anode fills. Derate charging current aggressively at low temperature. Level 2 charging as the daily default with DCFC reserved for genuine need is, per the fleet data, worth several percentage points of SOH over eight years.
Use the BMS for More Than Protection
The modern battery management system should do more than enforce limits. Useful additions include cell-level SOH tracking to catch outliers, adaptive current limits based on temperature and estimated anode potential, balancing strategies that do not park cells at high SOC, and logging at sufficient resolution to support later diagnostics.
Size for the Fade Curve
For grid-scale energy storage systems, capacity fade is a commercial input, not just a technical one. You either overbuild at commissioning so the faded system still meets its obligation, or you plan augmentation, adding capacity during the asset's life. Both are decisions made at financial close, and both depend on a defensible degradation model.
Recommended Reading: Energy Storage System (ESS) Technologies Most Suitable for Renewable Energy Usage
Common Mistakes and Troubleshooting
Treating SOH as a Single Metric: Capacity and resistance degrade independently. The pack at 90% capacity SOH with badly degraded power capability will still fail a power-limited application. Track both capacity-based and resistance-based SOH.
Assuming Linear Extrapolation is Safe: Knee behaviour means a linear fit through early data can be badly optimistic. Build margin for nonlinear aging, especially in designs using silicon-containing anodes or aggressive fast charging.
Testing Only at 25 °C: Room-temperature cycling misses both plating (which needs low temperatures or high C-rate) and accelerated SEI growth plus metal dissolution (which need high temperatures). Test the corners of your actual envelope.
Confusing Overcharging with High SOC Operation: Overcharging pushes cells beyond their voltage limit and is a safety event. Routine operation at high SOC is not a safety event; it just ages the cell faster. They need different mitigations.
Ignoring Deep Discharges at the Bottom: Deep discharges below the recommended cutoff risk copper current collector dissolution, which is unrecoverable damage rather than ordinary wear.
Diagnosing Plating Too Late: Watch for a discharge-voltage plateau and drops in coulombic efficiency. Both appear before capacity loss becomes obvious.
Conclusion
Battery degradation is the predictable outcome of side reactions and mechanical strain running alongside the chemistry you want. It concentrates into three modes: lithium inventory loss, active material loss, and impedance growth, driven by a handful of mechanisms, with SEI growth, lithium plating, transition metal dissolution, and particle cracking doing most of the damage.
The levers that move the outcome are few and well characterised: temperature, state-of-charge window, charging C-rate, and upper cutoff voltage. Fleet data confirms the lab results, with charging behaviour alone separating 88% from 76% capacity retention after eight years.
Design for the fade curve you will actually get, measure enough to detect mode changes rather than just capacity, and leave margin for the possibility that aging turns nonlinear before you expect it.
Frequently Asked Questions
Q. What causes battery degradation in lithium-ion batteries?
A. Lithium-ion battery degradation is mainly driven by SEI growth, lithium plating, transition-metal dissolution, and electrode cracking. These processes consume cyclable lithium, increase internal resistance, and reduce active material, with their severity strongly influenced by temperature, charging rate, voltage, and cycling conditions.
Q. How fast do EV batteries degrade?
A. Fleet data across more than 22,700 vehicles shows an average of 2.3% per year, giving about 81.6% capacity after eight years. Vehicles that rarely DC fast charge average 1.5% per year, and heavy high-power fast charging users average 3.0% per year.
Q. Does fast charging damage batteries?
A. Yes, measurably, though less than commonly assumed. Vehicles with over 40% of sessions above 100 kW degrade at 3.0% per year against 1.5% for those under 12% DCFC usage. The mechanism is lithium plating, which occurs when charging current outpaces the anode's ability to absorb lithium, and the risk rises sharply at low temperatures and high SOC.
Q. What state of charge should I store a battery at?
A. Mid-range, not full. Calendar aging is strongly governed by SOC and temperature, with higher SOC accelerating capacity fade through intensified SEI growth. DC resistance growth does not follow the same pattern, so storage SOC optimised for capacity retention is not automatically optimal for power retention.
Q. What is the difference between calendar aging and cycle aging?
A. Calendar aging accumulates with time at a given temperature and SOC, driven mainly by SEI growth, and continues even when the cell is idle. Cycle aging accumulates with charge throughput, driven by plating, particle cracking, and SEI cracking and regrowth. Both run concurrently in any real application.
Q. At what SOH is a battery considered end of life?
A. The convention places it between 70% and 80% SOH, with 80% the common contractual threshold for EV and grid storage applications. This is a commercial convention rather than a physical limit: cells below 80% often remain serviceable in less demanding second-life applications.
Q. Do LFP batteries degrade slower than NMC?
A. LFP batteries generally provide longer cycle life and greater tolerance to repeated cycling than NMC batteries, making them attractive for stationary storage. NMC offers higher energy density but is typically more sensitive to elevated voltage, heat, and aggressive operating conditions.
References
[1] Xu, P., et al. State of Health Estimation of LIB based on Discharge Section with Multi-Model Combined [Cited 2026 August 16] Available at: Link
[2] Agubra, V., and Fergus, J. Lithium Ion Battery Anode Aging Mechanisms [Cited 2026 August 16] Available at: Link
[3] Ruff, Z., Xu, C., and Grey, C. P. Transition Metal Dissolution and Degradation in NMC811-Graphite Electrochemical Cells [Cited 2026 August 16] Available at: Link
[4] Attia, P. M., et al. Review — “Knees” in Lithium-Ion Battery Aging Trajectories [Cited 2026 August 16] Available at: Link
[5] Yang, Z., et al. "Study on Influencing Factors of Calendar Aging and Cycle Aging of LFP Batteries [Cited 2026 August 16] Available at: Link
[6] Von Kolzenberg, L., Stadler, J., Fath, J., Ecker, M., Horstmann, B., and Latz, A. A Four Parameter Model for the Solid-Electrolyte Interphase to Predict Battery Aging during Operation [Cited 2026 August 16] Available at: Link
[7] GEOTAB. How Long Do Electric Car Batteries Last? The Updated Guide to Real-World EV Battery Health [Cited 2026 August 16] Available at: Link
[8] International Electrotechnical Commission. IEC 62660-1:2018 Secondary Lithium-Ion Cells for the Propulsion of Electric Road Vehicles - Part 1: Performance Testing [Cited 2026 August 16] Available at: Link
in this article
1. Key Takeaways2. Introduction3. What Battery Degradation Actually Means?4. The Three Degradation Modes5. Degradation Mechanisms Inside a Lithium-Ion Cell6. Calendar Aging Versus Cycle Aging7. What Actually Drives the Rate?8. Nonlinear Aging and the Knee Problem9. Chemistry Matters: LFP and NMC10. Real-World Degradation Data11. How Battery Degradation Is Measured?12. Designing to Slow Battery Degradation13. Common Mistakes and Troubleshooting14. Conclusion15. Frequently Asked Questions16. References