Surface Finish Chart: Ra, Rq, and N-Grade Conversions
A reference chart for converting between surface finish units, plus Ra values by manufacturing process and the relationship between surface

01 Oct, 2026. 7 minutes read
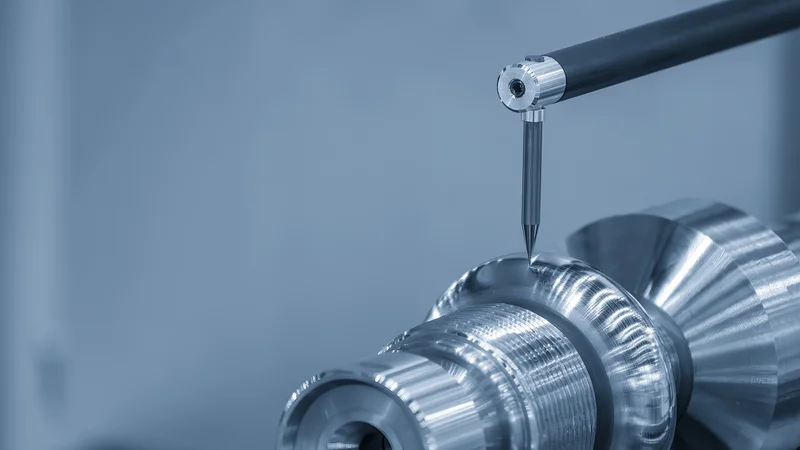
Surface finish can be specified in many different ways
Key Takeaways
The surface finish chart below converts between Ra in micrometers, Ra in microinches, and ISO N-grades.
For most machined surfaces, Rq (RMS) is about 11% higher than the Ra value, but you cannot obtain an accurate Rq from Ra alone.
N-grades come from ISO 1302, which ISO records as withdrawn and replaced by ISO 21920-1:2021. But they still appear on drawings, so you still need to read them.
The Surface Finish Chart
This is the core conversion table, with the first three columns taken directly from ISO 1302.[1] Ra is the reference column, because every other unit here is derived from it or maps onto it.
N-grade | Ra (µm) | Ra (µin) | Typical Rq/RMS (µin) | Notes |
N1 | 0.025 | 1 | 1.1 | |
N2 | 0.05 | 2 | 2.2 | |
N3 | 0.1 | 4 | 4.4 | |
N4 | 0.2 | 8 | 8.9 | |
N5 | 0.4 | 16 | 17.8 | Finest as-machined finish[2] |
N6 | 0.8 | 32 | 35.5 | |
N7 | 1.6 | 63 | 69.9 | |
N8 | 3.2 | 125 | 138.8 | Standard as-machined finish[2] |
N9 | 6.3 | 250 | 277.5 | |
N10 | 12.5 | 500 | 555 | |
N11 | 25.0 | 1000 | 1110 | |
N12 | 50.0 | 2000 | 2220 |
The Rq column is computed as Ra × 1.11 for reasons explained below.
Note that the microinch and micrometer columns are the conventional rounded pairs, not exact conversions.
How to Read This Surface Finish Chart
Ra, Rq, Rz, and Rt are all roughness parameters computed from the same measured roughness profile, so one measurement can report several of them at once.
Ra
Ra is the arithmetic mean of the absolute height deviations of the roughness profile from the mean line, measured over the evaluation length.[3]
ASME B46.1-2019 gives the discrete form used by digital instruments as:[3]
Ra = (|Z1| + |Z2| + |Z3| ... |ZN|) / N
Where each Z value is a measurement of an absolute deviation (either a peak or a valley) from the mean line. N represents the total number of measurements taken.
The abbreviations on older drawings all mean the same measurement:
Abbreviation | Stands for | Notes |
Ra | Roughness average | Current ISO and ASME designation |
CLA | Center line average | Older British usage. Numerically identical to Ra in µin |
AA | Arithmetic average | Older American usage. Same measurement |
Rq | Quadratic mean | A different calculation, not a different name. See below |
RMS | Root mean square | The same as Rq |
Rq
Rq, sometimes written as RMS, is the square root of the mean of the squared height deviations. Squaring before averaging weights large peaks and valleys more heavily than Ra does, so Rq always reads slightly higher than Ra on the same surface profile.[4]
For most machined surfaces, Rq is approximately 11% higher than Ra, giving the rule of thumb Rq ≈ Ra × 1.11.[5] That factor is exact only for an idealized sinusoidal profile—a surface that rises and falls with perfectly consistent repetition. Real surfaces depart from it, and the rougher and less regular the surface, the less reliable it becomes. In other words, you cannot get an exact Rq value from your Ra value; you need data from the measured profile to calculate it.
N-grades
N-grades, defined by ISO 1302, compress a roughness specification into a single number from N1 to N12, and each step roughly doubles Ra.[1]
However, ISO 1302:2002 has been withdrawn and replaced by ISO 21920-1:2021.[1][6]
So N-grades are a notation from a superseded standard. They have not vanished from drawings, which is why the chart includes them, but a new drawing is better served by an explicit Ra value with its cutoff stated. If you are updating drawing templates, note that ISO 21920-1 also changed the default acceptance rule to the maximum rule.[6]
Rz
Ra and Rz describe different things. Ra averages every deviation from the mean line, while Rz averages the most extreme deviations from each sampling length, so it is more sensitive to pronounced peaks and valleys.[4]
Two surfaces with the same Ra value can have very different Rz values depending on whether the roughness profile is uniform or punctuated by isolated scratches and burrs. One value cannot be converted from the other.
Recommended reading: RA vs RZ: Understanding Surface Roughness Parameters in Engineering
Cutoff λc
A surface roughness value is incomplete without its filter cutoff, and this is the single most common reason two parties measuring the same part disagree.
The cutoff separates roughness from waviness. ASME B46.1-2019 demonstrates the effect on one measured profile: at a 0.8 mm cutoff it reports Ra 0.057 µm, at 0.25 mm it reports 0.044 µm, and at 0.08 mm it reports 0.028 µm.[3]
When the drawing does not state a cutoff, B46.1-2019 gives guideline values selected from the measured Ra.[3]
Ra (µm) | Cutoff λc (mm) | Evaluation length L (mm) |
up to 0.02 | 0.08 | 0.40 |
0.02 to 0.10 | 0.25 | 1.25 |
0.10 to 2.0 | 0.80 | 4.0 |
2.0 to 10.0 | 2.5 | 12.5 |
over 10.0 | 8.0 | 40.0 |
Most machined work falls in the 0.10 to 2.0 µm band, which is why a 0.8 mm cutoff and a 4.0 mm evaluation length is the common default. The sampling length equals the cutoff when a filter is used.[3]
Lay
Lay, the predominant direction of the surface pattern, is specified separately from the roughness number.[3] It is called out with its own symbol set, including R for radial and C for circular. Surface finish symbols indicate lay, the parameter, the limit, and the cutoff together on the drawing.
Recommended reading: Surface Finish: Parameters, Standards, and How to Specify It
Ra Values by Manufacturing Process
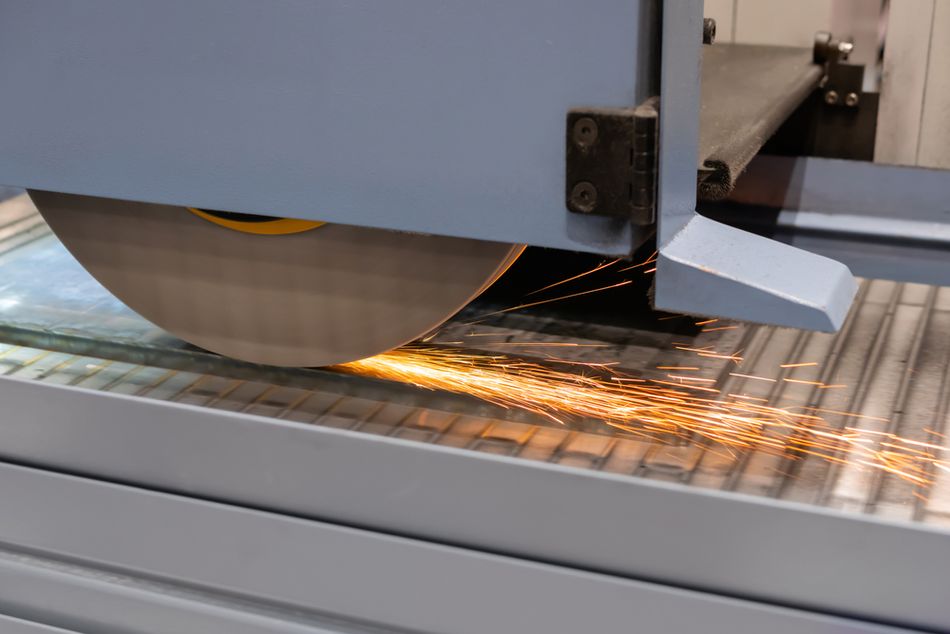
Different processes can achieve different levels of surface smoothness. However, which exact finish a manufacturing process can reach depends on the material, the tooling, the machine, and the parameters.
Process | Typical Ra (µm) | Quality band |
Lapping | 0.1 to 0.2[7] | Very fine |
Honing | 0.2 to 0.4[7] | Fine |
Grinding | 0.4[7] | Fine |
CNC turning | 3.2[2] | Medium to fine |
CNC milling | 3.2[2] | Medium |
Rough machining | 25[5] | Rough |
Sand casting | 50[5] | Rough |
Within any one process, the finish is driven by the details. In CNC machining, feed rate, spindle rpm, tool nose radius, rigidity and tool wear all affect the achievable finish, which is why the same nominal operation on two machines will not give you the same surface texture.
Secondary operations are equally important. Honing refines a bore beyond what boring alone reaches, deburring removes the burrs left at cut edges, and bead blasting produces a uniform matte non-directional texture. Powder coating and similar coatings add a layer that inherits and modifies the texture underneath.
Bulk-forming processes sit at the coarse end, and the surface roughness values of processes like forging and rolling are usually a starting condition to be machined away rather than a finish to be met.
The Price of Lower Ra Values
Surface finish generally becomes more expensive as the required Ra decreases. Rough machining can achieve relatively high Ra values with standard cutting tools and short cycle times, while finer finishes require slower feeds, sharper or more specialized tooling, and better machine stability.[5] Once conventional machining approaches its practical limit, processes such as grinding, honing, lapping, polishing, or superfinishing may be needed, adding both processing time and setup costs.[7]
The relationship is not linear. Reducing Ra from 3.2 to 1.6 µm may require only a modest change in machining conditions, while reducing it from 0.8 to 0.4 µm can require a substantially different process. For this reason, specifying a finer surface finish than the function of the part requires can increase manufacturing cost without providing a corresponding benefit.
Abrasive Grit to Ra
Abrasive grit numbers map onto Ra only loosely, and the mapping depends on which grit scale is being quoted. The bands below are on the FEPA P-scale for coated abrasives, standardized as ISO 6344.[6]
Grit (FEPA P) | Ra (µm), approx. | Ra (µin), approx. | Typical use |
P40 to P60 | 3 to 5 | 120 to 200 | Stock removal, weld knock-down |
P80 to P120 | 1.5 to 3 | 60 to 120 | Blending, coarse shaping |
P150 to P240 | 0.8 to 1.5 | 32 to 60 | Pre-finish smoothing |
P320 to P600 | 0.3 to 0.8 | 12 to 32 | Finishing, sealer scuff |
P800 to P1200 | 0.1 to 0.3 | 4 to 12 | Polish preparation |
P1500 and finer | under 0.1 | under 4 | Pre-buff, high-gloss start |
How the Measurement Is Taken
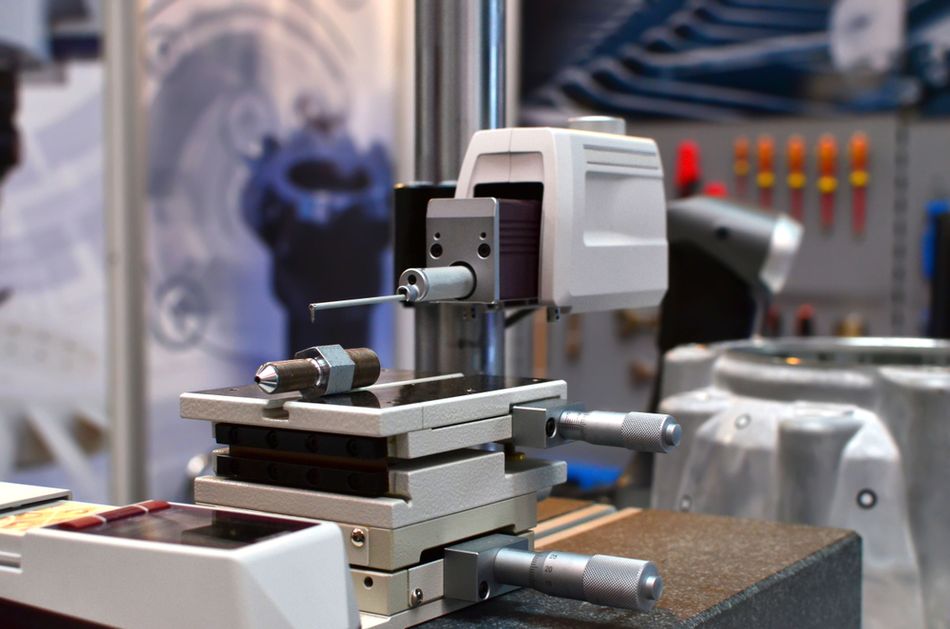
Surface finish measurement varies depending on the equipment used.
A contact surface roughness tester drags a stylus of known tip radius across the surface at fixed speed and records height data at a set interval.[3] These instruments, generally called profilometers, produce the surface profile that every parameter in the chart is computed from.
A non-contact method uses optical interaction instead: focus variation, confocal microscopy or interferometry. Optical instruments capture an area rather than a single line, which matters when the texture of a surface is directional.
Conclusion
A surface finish chart is a unit converter, but it cannot tell you what Rz corresponds to your Ra, because that depends on the shape of the roughness profile. Use the chart to translate between units, then specify the parameter, the limit, the cutoff, and the standard explicitly on your technical drawings. Then the number will mean the same thing to you and to whoever makes the part.
Frequently Asked Questions
What does a 32 surface finish mean?
Ra 32 µin, equivalently Ra 0.8 µm or N6, a general engineering finish.
What is the difference between Ra and Rq?
Ra averages the absolute deviations from the mean line; Rq squares them first, which weights large peaks and valleys more heavily. On the same profile Rq typically reads about 11% higher, so RMS ≈ Ra × 1.11 as a rule of thumb.[5] They are two calculations on one measurement, not two measurements.
Is CLA the same as Ra?
Yes. Center line average is an older name for the same arithmetic average measurement.
How do I convert Ra to Rz?
You cannot do it reliably, as the Ra value has already “smoothed out” the extremes of which Rz is a measure.
Are N-grades still valid?
They come from ISO 1302, which ISO lists as withdrawn and replaced by ISO 21920-1:2021.[1][6] They remain common on existing drawings, so you still need to read them, but new drawings are better served by an explicit Ra value with its cutoff.
Why do two shops measure the same part differently?
Usually the filter cutoff. ASME’s own example gets Ra 0.057 µm and Ra 0.028 µm from one profile by changing the cutoff.[3]
What Ra can CNC machining reach?
Roughly 3.2 µm as machined, down to about 0.4 µm with further finishing passes.[2]
References
[1] International Organization for Standardization. ISO 1302:2002: Geometrical Product Specifications (GPS) — Indication of surface texture in technical product documentation. Geneva: ISO; 2002.
[2] Protolabs Network. What are the types of surface finishes for CNC machining? [Internet]. Protolabs Network; [cited 2026 Sep 30].
[3] American Society of Mechanical Engineers. B46.1-2019: Surface texture (surface roughness, waviness, and lay): reference poster. New York: ASME; 2019.
[4] Keyence. How surface height is quantified, from Ra to Rz [Internet]. Keyence; [cited 2026 Sep 30].
[5] Astro Pak. Surface roughness average (Ra): chart, formula, and conversion calculator [Internet]. Astro Pak; [cited 2026 Sep 30].
[6] International Organization for Standardization. ISO 21920-1:2021: Geometrical Product Specifications (GPS) — Surface texture: Profile — Part 1: Indication of surface texture. Geneva: ISO; 2021.
[7] Grzesik W, Kruszynski B, Ruszaj A. Surface integrity of machined surfaces. In: Grzesik W, editor. Surface integrity in machining. London: Springer London; 2010. p. 143-179.
[8] Whitby Abrasives. Grit-to-surface-finish (Ra) chart [Internet]. Whitby Abrasives; [cited 2026 Sep 30].