RA vs RZ: Understanding Surface Roughness Parameters in Engineering
This comprehensive guide explains the difference between Ra vs Rz surface roughness parameters, how to measure them, and when to use them.

21 Aug, 2025. 9 minutes read
Surface finish is often treated as a mechanical detail, yet it plays a critical role in nearly every hardware design. Whether you are laying out a high‑frequency PCB, specifying a housing for a ruggedized module, or developing a precision connector, the micro‑texture of contact surfaces affects electrical continuity, thermal performance, friction, wear, sealing, and even aesthetic appeal
Ra vs Rz concerns two different ways that engineers can measure and specify this surface texture. Ra (roughness average) is the most common surface‑roughness parameter, but it tells only part of the story—it averages out the tiny peaks and valleys and thus hides extremes. Rz (maximum roughness height), on the other hand, captures those extremes by focusing only on the biggest peaks and valleys. Understanding Ra vs Rz is essential for digital design engineers, hardware engineers, and other professionals who need to control functional surfaces within tight tolerances.
This article dives deep into the theory and practice behind these parameters. It explains how they are defined, illustrates the instrumentation used to measure them and discusses their practical implications. Readers will learn how to interpret surface‑finish specifications, how to choose between Ra vs Rz and why advanced 3D parameters may be necessary for high‑performance designs.
The Fundamentals of Surface Roughness
Surface roughness describes the small‑scale variations in height on a surface. Imagine the surface of a machined metal part as a terrain with peaks and valleys. Roughness parameters quantify the deviations of this terrain from a reference line or plane.[1] These parameters help engineers verify that parts meet functional and aesthetic requirements, such as ensuring a seal, reducing friction, improving adhesion, or achieving a specific appearance.
Manufacturing processes inherently introduce roughness. Turning, milling, and drilling leave tool marks; casting produces as‑cast textures; and finishing processes like grinding, lapping, and polishing progressively reduce roughness. Thus, controlling process parameters directly influences surface finish.
For digital design and hardware engineers, surface texture influences many performance characteristics:
Electrical contact resistance: connector pins and PCB pads require controlled roughness to maintain stable contact over thermal cycles and vibrations.[2] High peaks can pierce coatings, while deep valleys may trap contaminants.
Thermal interfaces: heat‑sink mounting surfaces need a controlled Ra to optimize contact area and thermal conductivity.
Sealing surfaces: O‑rings and gasket interfaces must avoid extreme valleys that create leak paths.
Wear and friction: sliding components like bearings benefit from surfaces that balance oil retention and smoothness.
Adhesion and coating: coatings adhere better when surfaces are within specified roughness ranges.
Recommended reading: Measuring Surface Roughness: A Comprehensive Guide
Understanding Ra (Roughness Average)
Definition and calculation:
Ra is the arithmetic mean of the absolute values of the surface profile deviations from a mean line over a sampling length. In simple terms, it measures how far peaks and valleys deviate from the center line on average.
Mathematically:
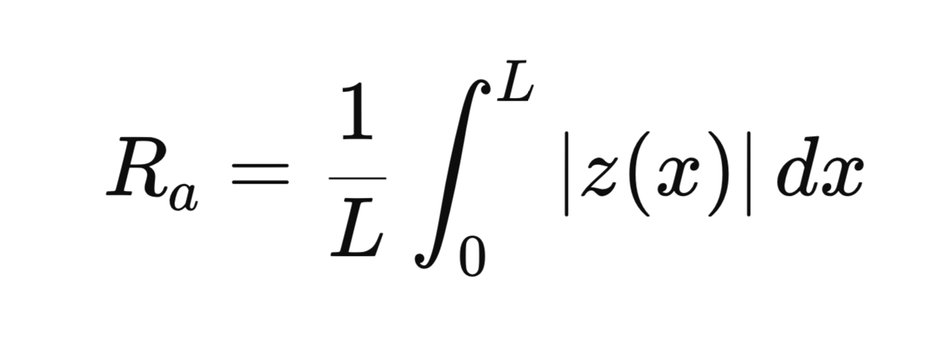
where:
L: sampling length
z(x): deviation of the surface from the mean line at position x
Ra is expressed in micrometres (µm) or microinches (µin).
Key characteristics of Ra:
Ease of measurement: stylus profilometers can quickly compute Ra from a single trace. Low-cost instruments and legacy data have made Ra the default parameter.
Insensitive to outliers: averaging all deviations suppresses the effect of spikes and pits. Two very different profiles can share the same Ra.
Useful for general roughness: Ra works well as a broad indicator of surface quality, particularly when extreme peaks or valleys are not critical.
The table below shows typical Ra values for certain machined surfaces, from coarse machined materials to polished ones.
Surface Finish Type | Typical Ra (µm) | Notes / Process Example |
Coarse machining | 6.3 – 25 | Rough turning, milling, shaping |
General machining | 3.2 – 6.3 | Standard turning or milling |
Fine machining | 1.6 – 3.2 | Light finish pass on lathe/mill |
Very fine machining | 0.8 – 1.6 | Finish turning, precision milling |
Grinding | 0.2 – 0.8 | Surface grinding, cylindrical grinding |
Superfinishing / honing / lapping | 0.025 – 0.2 | Optical surfaces, high-precision seals |
Polished | ≤ 0.025 | Mirror finishes, mold tooling |
Understanding Rz (Mean Roughness Depth)
Definition and calculation:
In ISO/DIN usage, Rz (mean roughness depth) is the arithmetic mean of the total peak-to-valley heights Rt measured over nn sampling lengths, where n is defined by the applicable standard or instrument settings. In simple terms, Rz describes the average vertical range from the tallest peak to the deepest valley in each measured section of a surface.
Mathematically:
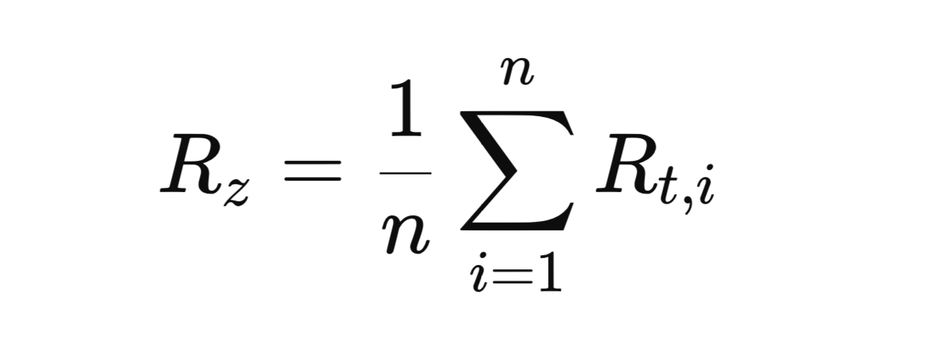
where Rt,i is the vertical distance between the highest peak and lowest valley within the i-th sampling length.
This differs from RzJIS (also called the ten-point height), which averages the heights of the five tallest peaks and the depths of the five deepest valleys within a single sampling length.[3] RzJIS was more commonly used in previous decades.
Key characteristics of Rz:
Sensitivity to defects: Rz responds strongly to extreme irregularities such as scratches, pits, or burrs.
Better discrimination: it can distinguish surfaces with similar Ra but very different functional performance.
Standard-dependent: definitions vary across standards and instruments, so clarity in specification is important.
Ra vs Rz: Comparative Analysis
The table below summarizes the theoretical differences between Ra and Rz.
Parameter | Definition | Calculation method | Sensitivity | Typical use |
Ra(Roughness Average) | Average of the absolute deviations of the surface profile from the mean line over the sampling length | Take all deviations from the mean line, convert them to absolute values, then average them | Low: smooths out peaks and valleys, less affected by single defects | General roughness specification, baseline quality control |
Rz (Mean Roughness Depth, ISO/DIN) | Average vertical distance between the highest peak and lowest valley in each sampling length | Measure the peak-to-valley height for each sampling length, then average those values | High: highlights extreme irregularities, sensitive to scratches or pits | Functional surfaces where extreme peaks/valleys affect performance (e.g., sealing, wear) |
Why No Fixed Conversion Factor Exists
Many online resources suggest simple conversion ratios between Ra and Rz (for example, “Rz ≈ 4 × Ra”). In reality, these ratios can vary widely—from about 2:1 to over 20:1—depending on the surface texture. Because Rz is more heavily influenced by extreme peaks and valleys, any fixed conversion is unreliable. The correct approach is to directly measure the parameter specified on the technical drawing or, when necessary, work with the customer or manufacturer to agree on the most appropriate roughness parameter for the application.
Recommended reading: CNC Programming: Mastering Precision and Efficiency in Engineering
Measurement Techniques and Standards
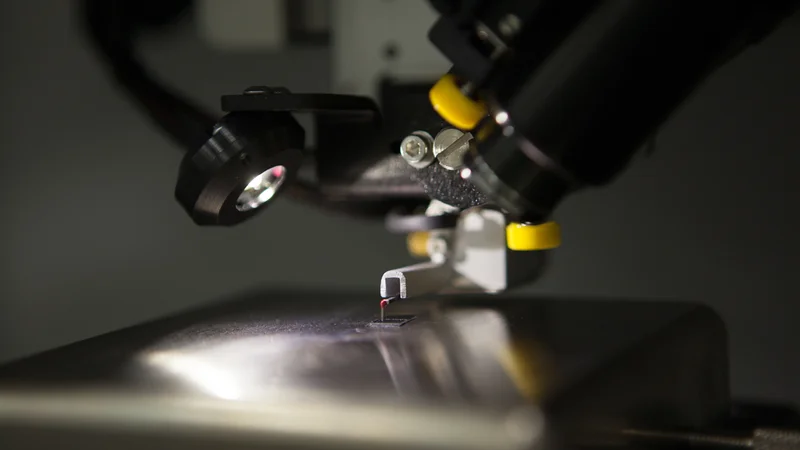
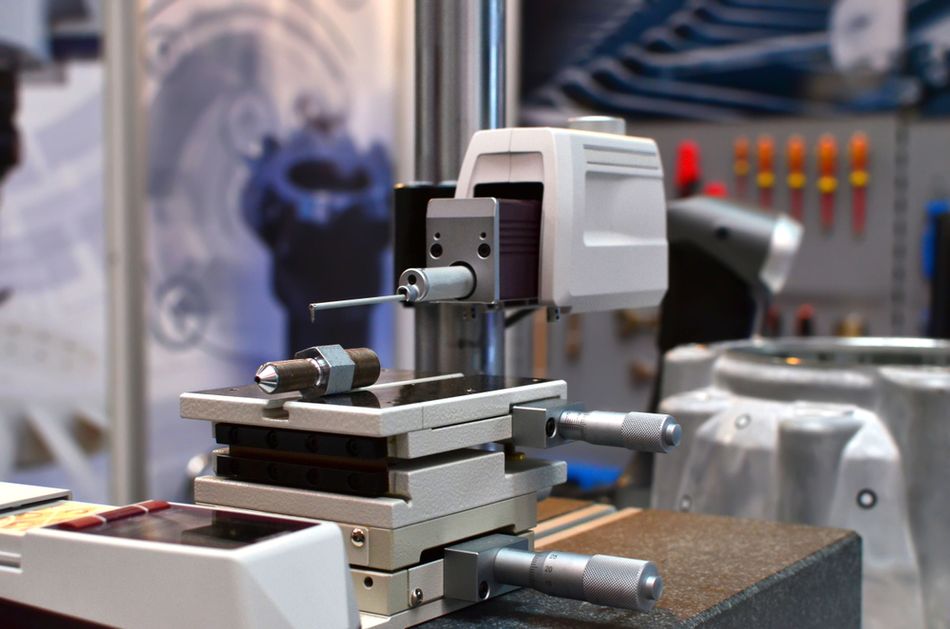
Stylus Profilometers
The most common tools for measuring Ra and Rz are stylus profilometers. A diamond-tipped stylus traces the surface while vertical deflection is recorded and converted into roughness data. Modern instruments often integrate digital processing for real-time calculation and output.
Key considerations include:
Stylus radius and pressure: A smaller radius can resolve fine details but risks damaging soft materials. Excessive pressure can compress the surface and distort results.
Sampling length and filtering: Cutoff lengths and filtering settings help separate surface roughness from larger-scale waviness.
Instrument capability: Not all gauges measure both Ra and Rz—some budget devices report only Ra.
Optical and 3D Profilers
Non-contact instruments such as white-light interferometers and confocal microscopes use optical methods to map surfaces in three dimensions. They measure height variations across an area without touching the sample, avoiding stylus wear or surface damage. These systems can capture both fine and large-scale features, and many can calculate standard profile parameters (Ra, Rz) as well as 3D areal parameters. They are typically more expensive and complex than stylus systems but offer faster data collection and are well suited for delicate or high-precision components.
Standards and Traceability
Surface-roughness parameters are defined in international standards. Documents such as ASME B46.1 and ISO 4287/ISO 4288 set definitions, sampling lengths, filtering rules, and reporting conventions for Ra, Rz, and many other parameters. Following these standards ensures that measurements are consistent, traceable, and comparable across different instruments and facilities.
Practical Implementation for Engineers
Specifying Surface Finish on Drawings
When specifying surface finish, include:
Parameter: Specify Ra, Rz, or both, including the standard used (ISO 4287/4288 or ASME B46.1). For example, “Rz < 6 µm (ISO 4287)” or “Ra 1.0 µm max (ASME B46.1).”
Value: Indicate the maximum allowable roughness (e.g., Ra 1.8 µm). Use appropriate units (µm or µin).
Sampling length and direction: Define the cutoff length and the direction of measurement relative to machining marks. Surfaces with directional textures (e.g., grinding) require measurements perpendicular to the lay.
Method: Optionally specify the type of measurement instrument (stylus or optical) if critical.
Controlling Surface Roughness
Engineers can control roughness through process choices and machining parameters. Key considerations include:
Cutting parameters: Feed rate, cutting speed, depth of cut, and toolpath strategy directly influence roughness. Lower feeds and shallower cuts usually yield smoother surfaces.
Tooling: Tool geometry and condition affect the lay and quality of machined surfaces. A worn or chipped tool increases roughness.
Material properties: Harder materials may produce smoother finishes but require specialized tooling; softer materials can deform under the stylus or cutting edge.
Coolant and vibration: Adequate cooling and rigid fixturing reduce chatter and improve surface finish.
Finishing processes: Grinding, honing, lapping, polishing, and bead blasting can reduce roughness after machining. For example, lowering lapping pressure can significantly improve Ra values.
Beyond Ra and Rz: 3D Roughness Parameters
Surface features at the nanometre scale can have a critical effect on component performance in many industries, from precision machining to medical devices. Traditional profile parameters such as Ra and Rz—developed in the 1930s for stylus-based measurements—are inherently one-dimensional. A single measurement trace may not represent the true variability of a surface, especially for parts with complex geometries or localized irregularities.
By contrast, 3D optical profilometry, developed in the late 20th century, captures areal data and enables computation of S-parameters (areal parameters) that describe amplitude, spatial distribution, and hybrid surface characteristics. This approach offers a more complete picture of surface function and quality.
The S-parameter family includes:
Sa: Average surface roughness across an area (3D analogue of Ra)
Sq: Root-mean-square roughness (3D analogue of Rq)
Sp / Sv: Maximum peak height and maximum valley depth
Sz: Average peak-to-valley height across the area (3D analogue of Rz)
Ssk / Sku: Skewness and kurtosis, describing the distribution of peaks and valleys
Sds: Summit density (number of summits per unit area), capturing texture uniformity and directionality
Sci / Svi: Core and valley fluid retention indices, important for lubrication and coating performance
Two surfaces with the same Ra can have very different S-parameter profiles, resulting in significant differences in friction, wear, fluid retention, or sealing effectiveness. For engineers specifying critical surfaces—whether in aerospace, tooling, optics, or medical devices—S-parameters can reveal performance-relevant details that 2D measurements may miss.
Although 3D measurements can involve higher equipment costs and longer setup times, they help prevent downstream failures, improve quality control, and optimise component functionality in demanding environments.
Conclusion
Understanding the difference between Ra and the Rz value is a practical necessity for engineers involved in design, prototyping, and CNC machining. Ra provides a quick, widely recognized average value of surface roughness, but it can mask significant peaks and valleys. Rz complements Ra by capturing peak-to-valley extremes, helping identify features that might compromise seals, increase wear, or reduce adhesion. Because they describe different aspects of a surface, Ra and Rz are not interchangeable and cannot be reliably converted from one another.
In practice, using both Ra and Rz—along with other parameters when needed—offers a more complete roughness profile of the part. Standards such as ASME B46.1 and ISO 4287/4288 define how these measurements should be specified and interpreted, and it’s important to confirm that roughness measurement equipment reports the parameters required. For critical applications, advanced 3D measurements and S-parameters can reveal details missed by traditional 2D metrics. As components and assemblies become smaller and tolerances tighter, these richer descriptors are increasingly important for ensuring functional performance and long-term reliability.
Integrating surface-roughness considerations into the machining process helps shorten prototyping cycles, improve product quality, and reduce the risk of costly failures in service. This means investing in appropriate metrology tools, training teams to understand surface parameters, and working closely with manufacturing partners to specify finishes that are both functional and achievable.
Frequently Asked Questions
What is the primary difference between Ra vs Rz?
Ra is the arithmetic average of absolute deviations from the mean line over a sampling length. Rz measures the average difference between the five highest peaks and the five deepest valleys, or the average of five peak-to-valley heights. Rz is more sensitive to outliers and highlights extreme surface irregularities, whereas Ra provides a general average.
Can I convert Ra to Rz?
There is no universal conversion factor between Ra and Rz because they describe different aspects of the surface. Published conversion ratios vary widely, and it’s generally advised not to rely on them. The best approach is to measure the parameter specified on the drawing or confirm the correct specification with the customer.
When should I specify Rz instead of Ra?
Use Rz when peak-to-valley extremes could affect functionality, such as sealing surfaces, sliding components, or coating adhesion. Rz helps identify isolated defects that Ra may hide. In many cases, specifying both parameters gives a more complete picture of the surface.
How do I measure Ra and Rz?
Most stylus profilometers compute Ra automatically. Check that your instrument supports Rz, as some basic gauges do not. For more comprehensive analysis, optical profilometers or 3D measurement tools can provide additional data. Always follow relevant standards for sampling length, filtering, and stylus pressure.
What standards define Ra and Rz?
ASME B46.1, ISO 4287, and ISO 4288 provide definitions, sampling lengths, and filtering rules for Ra, Rz, and other roughness parameters. Referencing these standards ensures consistency and traceability in measurement and specification.
References
[1] Hobson RD. Surface roughness in topography: quantitative approach. InSpatial analysis in geomorphology 2019 Apr 10 (pp. 221-246). Routledge.
[2] Kharina V, Kurek A. Derating of Electrical Contacts with Varying Surface Roughness. Applied Sciences. 2025 May 30;15(11):6196.
[3] Wang Z, Wang Y, Bai X, Zhang S, He W, Zhang X, Han S, Yan Y. Micro-information-level AR instruction: a new visual representation supporting manual classification of similar assembly parts. Multimedia Tools and Applications. 2023 Mar;82(8):11589-618.
in this article
1. The Fundamentals of Surface Roughness2. Understanding Ra (Roughness Average)3. Understanding Rz (Mean Roughness Depth)4. Ra vs Rz: Comparative Analysis5. Measurement Techniques and Standards6. Practical Implementation for Engineers7. Beyond Ra and Rz: 3D Roughness Parameters8. Conclusion9. Frequently Asked Questions10. References