Single Point of Failure: How to Find and Eliminate SPOFs
A single point of failure is any part whose failure stops the whole system. Learn how engineers find SPOFs with FMEA and fault trees, quantify them with reliability math, and remove them with N+1, 2N, failover, quorum, and voting designs, and why common cause failures can still defeat redundancy.

26 Oct, 2026. 26 minutes read
Single point of failure
Key Takeaways
A single point of failure (SPOF) is an item whose failure would stop the system and that is not compensated for by redundancy or by an alternative operating procedure.[1]
In a fault tree, any minimal cut set with one basic event is a single failure that alone can cause the top event, so the one-event cut sets are the SPOFs of the modeled system.[2]
Redundancy works by multiplying failure probabilities: two independent subsystems at 99% availability give 99.99%.[3] The word that matters is independent.
Common cause failures break that assumption. In NASA's worked example of three redundant components, each with a failure probability of 1 in 1,000, a common cause present in 1% of failures makes losing all three 10,000 times more likely than the independent calculation predicts.[2]
The stakes are real: in Uptime Institute's 2025 Annual Survey, 57% of respondents said their most recent major outage cost more than $100,000.[4]
Introduction
A single point of failure (SPOF) is any component, connection, service, or procedure that takes the whole system down when it fails. It can be a lone UPS module, a PLC with no standby CPU, a single default gateway, a database leader, or a software update that reaches every server at the same moment.
Finding and removing SPOFs is a core task in reliability engineering and high-availability design, and the cost of missing one is measurable. Uptime Institute's 2026 Annual Outage Analysis reports that in its 2025 Annual Survey, 57% of respondents said their most recent major outage cost more than $100,000, and for the second consecutive year one in five reported costs exceeding $1 million.[4] In aerospace, NASA's general policy is not to permit the retention of single failure points in a design unless special conditions, such as technology, operations, or cost, prohibit designing them out.[5]
This guide covers what counts as a single point of failure, the reliability math behind redundancy, the analysis methods engineers use to find SPOFs, the design patterns that remove them, and the common-cause failures that quietly defeat redundancy, with examples from power systems, datacenters, networks, industrial control, safety instrumented systems, and cloud infrastructure.
What Is a Single Point of Failure?
A single point of failure (SPOF) is any component, connection, service, or procedure whose failure stops the entire system, with no redundancy or alternative operating procedure to compensate. The definition comes from MIL-STD-1629A (1980), which calls it a single failure point: an item whose failure causes system failure and is not compensated for by redundancy or an alternative operational procedure.[1]
A component is only a SPOF if its failure stops the system and nothing compensates for it. Degradation is not enough: a server that halves throughput when one disk dies is not a SPOF. Compensation is not limited to duplicate hardware either. MIL-STD-1629A counts an alternative operating procedure, defining compensating provisions as actions an operator can take to negate or mitigate a failure’s effect on the system.[1]
Safety-critical standards scope the same definition by consequence and by cause. NASA scopes by consequence: its reliability practice describes a typical single failure point as a hardware item, usually at component level, whose failure could cost the vehicle, the mission, or a life.[5] The US Nuclear Regulatory Commission scopes by cause: its General Design Criteria define a single failure as an occurrence that costs a component its intended safety function, then add that multiple failures resulting from one occurrence count as a single failure.[6]
Redundancy only helps when the redundant paths do not share a cause. Two cables routed through the same tray are two components but one failure: a fire in that tray takes both, and the system sees a single point of failure regardless of how the diagram was drawn. This is why counting components is a poor test for redundancy and tracing causes is a good one.
SPOF vs Related Reliability Terms
The standards call this a single failure point, or SFP. This guide uses the more common single point of failure, or SPOF, for the same thing.
Term | Meaning | Where you meet it |
Single failure point (SFP) | The failure of an item that causes failure of the system and is not compensated for by redundancy or an alternative operational procedure.[1] | FMEA and FMECA, single failure points lists |
Single failure criterion | A fluid or electric system is considered designed against an assumed single failure if it keeps its safety function given either a single active-component failure, assuming passive components work, or a single passive-component failure, assuming active components work[6] | Nuclear power plant design |
Common cause failure (CCF) | Two or more component failures that occur at the same time or within a relatively short interval, due to a common cause[2] | Fault tree analysis, reliability modeling |
Minimal cut set (MCS) | The smallest combination of basic events that results in the top event of a fault tree[2] | Fault tree analysis |
Hardware fault tolerance (HFT) | Redundant elements added to allow for failures: 1oo1 is HFT 0, 1oo2 is HFT 1[7] | Functional safety (IEC 61508, IEC 61511) |
Why Single Points of Failure Matter: Downtime, Cost, and Safety
Uptime Institute's 2026 Annual Outage Analysis shows where outages start. Power remains the leading cause of impactful outages, and "failures involving UPS systems, transfer switches and generators are dominant."[4] That is a reminder that backup equipment brings failure modes of its own.
The same analysis points to other failure sources. Where human error causes an outage, the most common root is staff not following the procedures already in place.[4] External infrastructure is a growing share of publicly reported outages, with fiber and connectivity problems both increasing in number and tending to keep systems down longer.[4] Uptime’s own read is that failures will increasingly come from interactions between systems rather than from one failed part. The dependency data bears that out.[4] Across nine years of Uptime’s tracking, roughly two in three publicly reported outages originated at a third-party provider rather than at the affected organization: cloud and internet firms, telecoms, and colocation operators.[4]
A single fiber route or a single undocumented recovery step can take down a site as surely as a failed UPS. And an outage at a provider you depend on is your outage too. In safety-critical systems, the stakes go beyond downtime: NASA's definition of a single failure point includes the loss of life, vehicle, or mission.[5]
The Math: Why Series Systems Are Fragile and Redundancy Helps
Reliability block diagrams make SPOFs visible. Two models do most of the work: the series model and the parallel (redundant) model.
Series Systems: Every Element Is a Single Point of Failure
The NIST/SEMATECH e-Handbook of Statistical Methods describes the series model as "assuming the system fails when the first component fails and all components fail or survive independently of one another."[8] Its rule of thumb: "Add failure rates and multiply reliabilities in the Series Model."[8]
NIST adds that the model "only applies to non replaceable populations (or first failures of populations of systems)."[8] The worked example below therefore looks at the first failure within one year.
If the system fails when the first component fails, then every component in a pure series system is a single point of failure. The system reliability is the product of the component reliabilities, so it is never higher than the reliability of the weakest element.
Parallel Systems: Failure Probabilities Multiply
In the parallel or redundant model, "the system works as long as at least one component still works," and the system's failure probability is the product of the component failure probabilities.[9] The first assumption NIST lists for that model is the one to watch: "All components operate independently of one another, as far as reliability is concerned."[9]
Worked Example: A Five-Element Control Loop
Take a control loop that needs five elements to work: a sensor, an I/O module, a controller, a network switch, and a power supply. Assume, for illustration, that each has a reliability of 0.99 over one year and that failures are independent.
Design | System reliability over one year | Probability the loop fails within the year |
Five single elements in series (five SPOFs) | 0.99⁵ = 0.951 | 4.9% |
Power supply duplicated (four SPOFs left) | 0.99⁴ × 0.9999 = 0.960 | 4.0% |
All five elements duplicated (no SPOFs, independent failures) | 0.9999⁵ = 0.9995 | 0.05% |
A duplicated element with two independent units at 0.99 fails only if both fail: 0.01 × 0.01 = 0.0001, so the pair has a reliability of 0.9999.[9] The table shows the pattern that matters in practice. Removing one SPOF barely moves the result, because four others remain. Removing all of them cuts the failure probability roughly a hundredfold, as long as the independence assumption holds.
Recommended Reading: Linear vs Switching Power Supply: Understanding the Differences
Availability, Spares, and Diminishing Returns
For availability, AWS’s “Availability and Beyond” whitepaper applies the same logic. The paper is archived, but the arithmetic is standard: two subsystems at 99% availability each fail 1% of the time, so both being down at once has probability 0.01%, putting the redundant pair at 99.99%.[3] In general, "a workload with s spares will only fail if s + 1 subsystems fail."[3]
Availability targets are usually quoted in "nines." Converting them into downtime over a year of 8,760 hours shows what each extra nine is worth:
Availability | Maximum downtime per year |
99% | 87.6 hours |
99.9% | 8.76 hours |
99.99% | 52.6 minutes |
99.999% | 5.3 minutes |
Spares are not free. The same whitepaper notes that each additional spare costs about what the original cost, so cost climbs at least linearly, which is why AWS calls redundancy “an optimization problem.”[3] It finds that using more than three spares "does not provide material, noticeable gain for almost all workloads when the subsystem itself has at least a 99% availability."[3]
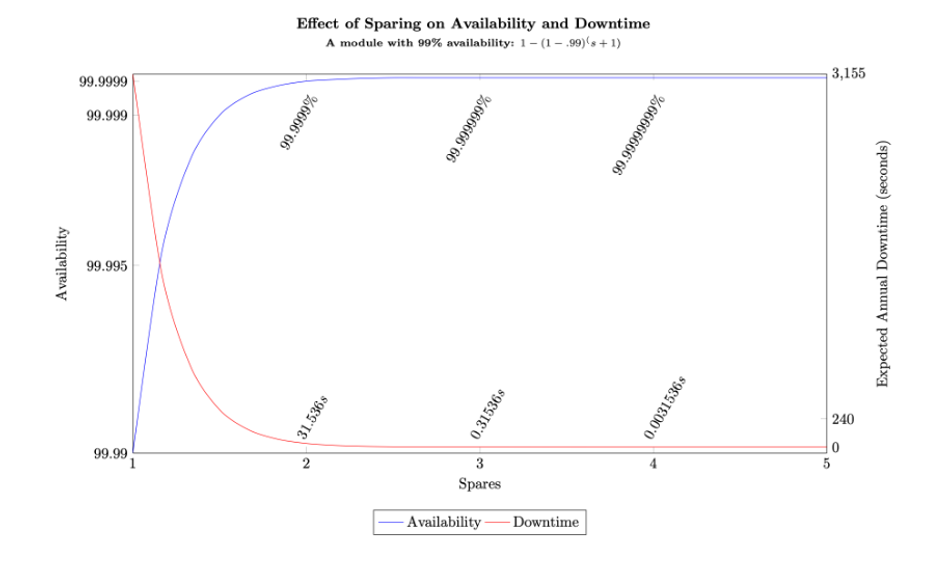
Availability also depends on how fast you recover. AWS cautions that MTBF and MTTR transfer poorly from hardware to distributed systems and that any forward-looking availability figure is a forecast rather than a guarantee, but it still holds that failing less often and recovering faster both raise empirical availability.[10] Fast, automatic failover is one way to shrink the recovery time.
Recommended Reading: What is Distributed Control System (DCS)?
How Engineers Find Single Points of Failure
No single method finds every SPOF, because each one looks in a different direction. Engineers use three: Failure Mode and Effects Analysis (FMEA), which works upward from individual parts; fault tree analysis, which works downward from bad outcomes; and dependency mapping, which looks outside the system entirely. The first two are deliberately paired, because each covers the other’s blind spot. The third catches what neither does.
Failure Mode and Effects Analysis (FMEA): Working Up From the Parts
FMEA starts at the bottom. You list every component, and for each one you ask two questions: what are the ways this can break, and if it breaks that way, what happens to the system as a whole? Anything whose failure would be severe enough goes onto a list that the program then has to account for.
NASA describes the method as a bottom-up analysis of each hardware or software element for each possible failure mode, followed by a determination of the worst-case effect of that failure on the system.[5] If an item can fail in a way that could cost the vehicle, the mission, or a life, it goes onto a critical items list, or CIL.[5] The analysis, in NASA’s words, “results in the identification of single failure points (SFPs) and critical redundant items.”[5]
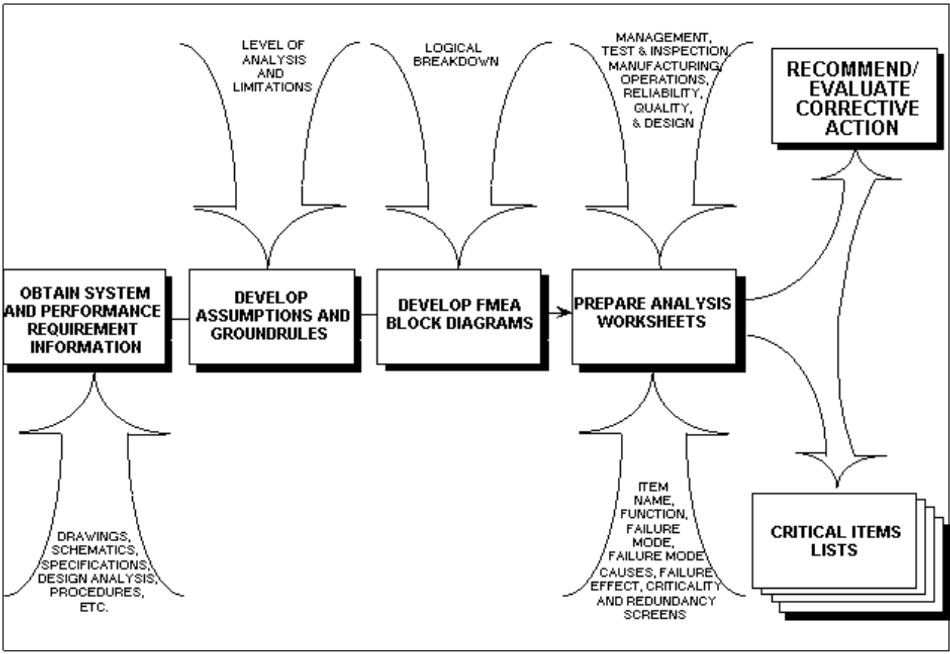
The output is meant to be a deliverable, not a filing exercise. MIL-STD-1629A requires the final report to identify “the single failure points which could not be eliminated from the design.”[1] NASA recommends starting the CIL early, before the design is frozen, and keeping the analysis alive alongside the design rather than running it once at the end.[5]
The method finds real problems. During Spacelab recertification after the Challenger accident, an FMEA found a single failure point in the jettison circuitry of the Instrument Pointing System (the NASA practice writes “Inertial”): a short in the emergency arming switch could fire all four NASA Standard Initiators at once.[5] The same effort found the payload retention latch assembly needed a redundant operating mode, and redundant end switches were added.[5]
FMEA’s blind spot is combinations. It analyses single component faults and does not consider combinations of them, so it will not find the pair of failures that is harmless separately and fatal together.[2]
Fault Tree Analysis: Working Down From the Outcome
Fault tree analysis runs the opposite way. You name the bad outcome first, called the top event, something like “loss of cooling.” Then you ask what could cause it, and what could cause each of those, branching downward until you reach basic events, the level of detail at which the analysis stops.
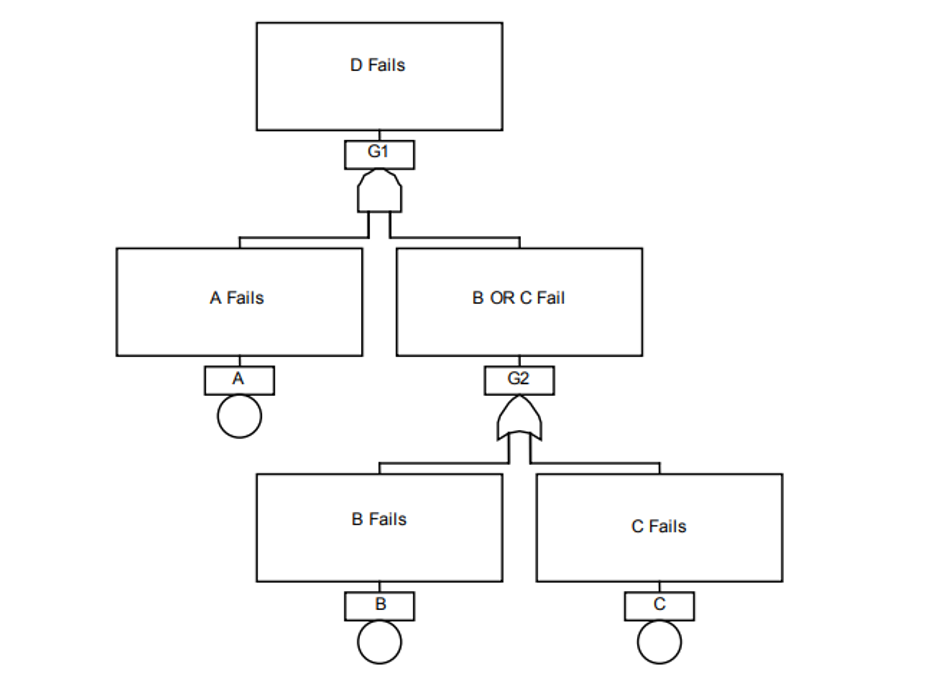
NASA describes this hazard analysis as “basically a top down approach” that considers multiple unrelated failure modes, which the FMEA ground rules exclude.[5] That is precisely the gap FMEA leaves.
What makes a fault tree useful for SPOF hunting is what you can read off it. A cut set is any combination of basic events that together produce the top event. It is minimal when you cannot remove anything from it and still get there. NASA’s Fault Tree Handbook defines a minimal cut set as “the smallest combination of basic events that result in the top event.”[2]
The payoff is in the size of those sets. A minimal cut set containing just one event means that one thing, by itself, causes the top event. That is a single point of failure, and the analysis hands it to you without being asked. The handbook puts it directly: “Any MCS with one basic event identifies a single failure or single event that alone can cause the top event to occur. These single failures are often weak links and are the focus of upgrade and prevention actions.”[2]
Cut sets also expose common cause failures hiding inside apparent redundancy. When the events in a cut set share characteristics, the handbook warns, that signals a susceptibility to common cause failure that can negate a redundancy.[2] Its example is a cut set made of identical valves: one manufacturing defect or one environmental sensitivity fails all of them together.[2]
Fault tree analysis has its own blind spot, the mirror of FMEA’s. A fault tree is not a model of all possible system failures; it is tailored to its top event and includes only the faults that contribute to it.[2] Name the wrong top event and the analysis is thorough about the wrong thing.
Dependency Mapping
Both methods above analyze a system with a line drawn around it. But the system also needs things from outside that line, and those fail too.
MIL-STD-1629A has a name for them. Interfaces are systems external to the one being analyzed that are necessary for it to perform its mission in an undegraded mode: power, cooling, heating, air services, input signals.[1] In software the list is different but the role is identical: DNS, authentication and identity providers, certificate services, time synchronization, deployment pipelines. If you depend on a cloud or colocation provider, their shared infrastructure belongs on the same map.
The AWS outage of 19 to 20 October 2025 shows how far these dependencies reach. The trigger was small: AWS traced it to “a latent race condition in the DynamoDB DNS management system that resulted in an incorrect empty DNS record for the service’s regional endpoint.”[11] One database service in one region became unreachable by name.
What followed was not confined to that database:
New EC2 instances stopped launching. The system that tracks which physical servers are available, DropletWorkflow Manager, checks in with each server every few minutes, and those checks depend on DynamoDB. With the checks failing, servers gradually dropped out of the available pool, and launch requests came back as insufficient capacity.[11]
Console sign-in failed for IAM users, with increased authentication failures traced to the same DynamoDB problem.[11]
Redshift customers in every AWS region, not only the affected one, could not use IAM credentials to run queries for about 90 minutes, because of a Redshift defect that called an IAM API in us-east-1 to resolve user groups.[11]
That last one is worth sitting with. A customer in another region, on a service with no obvious relationship to the failure, was affected through a dependency they had no way to see.
The DNS automation was not carelessly built. The component that applies DNS changes ran “redundantly and fully independently in three different Availability Zones.”[11] The redundancy was real. What defeated it was a flaw the three copies shared: an unlikely interaction between two of them, in which one copy that had been unusually delayed applied a much older plan over a newer one, after which the cleanup process deleted it.[11] Three independent copies of the same logic are not three independent failure modes.
AWS has since disabled the DynamoDB DNS Planner and Enactor automation worldwide, and says it will fix the race condition and add protections against incorrect DNS plans before turning it back on.[11]
A Practical SPOF Review, Step by Step
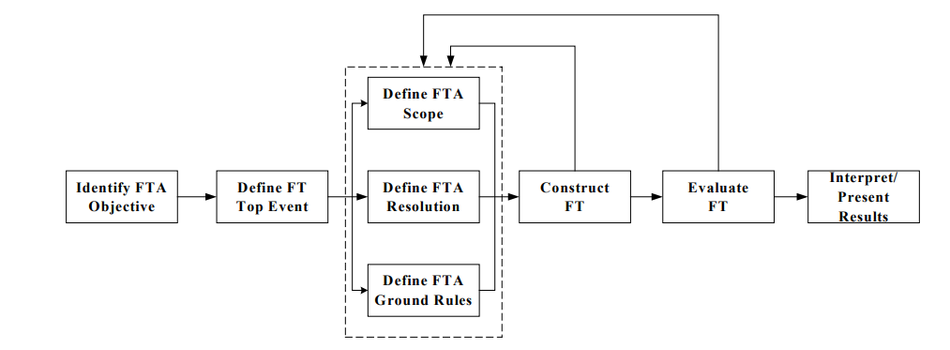
Define the function that must survive. Write the top event as a loss of function ("line stops," "no writes accepted"), not as a component failure.[2]
Map dependencies across the boundary. Include the interfaces that supply power, cooling, air services, and input signals, plus shared software services.[1]
Run a bottom-up FMEA. Mark every single failure point and every critical redundant item.[5]
Build a top-down fault tree. List the minimal cut sets; every one-event cut set is a SPOF.[2]
Screen cut sets for common causes. Events with identical characteristics (same part, same software build, same location) are common cause candidates.[2]
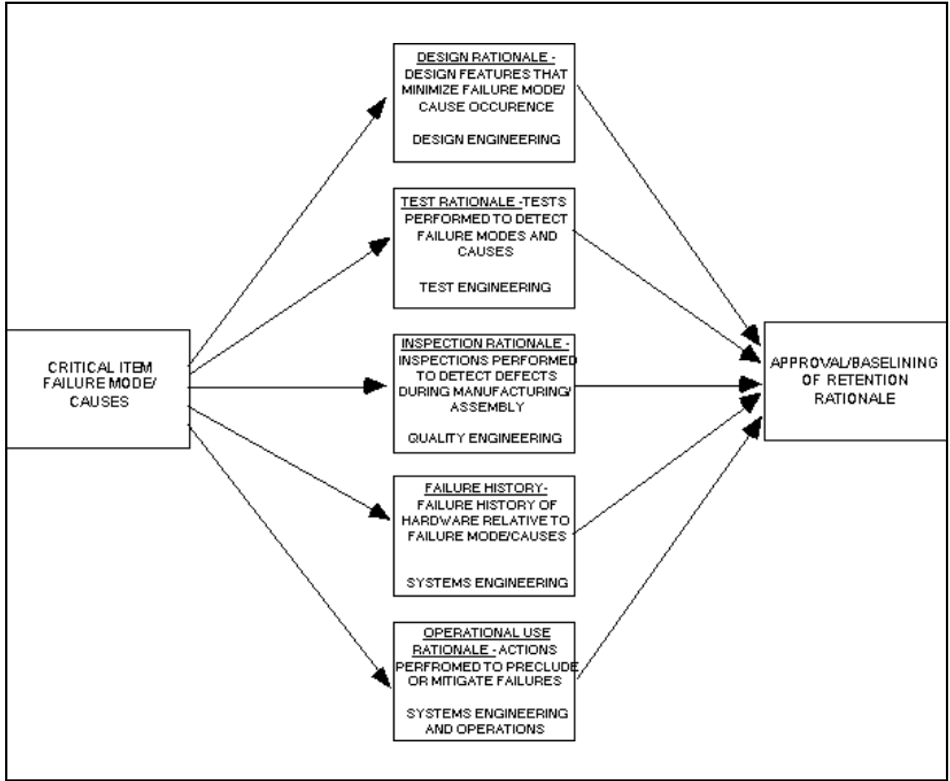
Decide per SPOF. Eliminate it with redundancy, mitigate it with a compensating provision, or retain it with a documented rationale covering design, test, inspection, failure history, and operational use.[5][1]
Maintain the analysis. Repeat it after every design change and throughout the life of the system.[5]
Common Single Points of Failure by Domain
The same pattern repeats across engineering disciplines: one shared element, and a known redundancy pattern that removes it.
Domain | Typical single point of failure | Typical mitigation |
Power distribution | One UPS group feeding both power supplies of a load | 2N or 2(N+1) UPS groups feeding the two power supplies separately[12] |
Data center facility | A single distribution path for power or cooling | Redundant distribution paths, concurrently maintainable (Tier III), or fault-tolerant independent systems (Tier IV) [13]. |
LAN routing | A statically configured default gateway | First-hop redundancy with VRRP[14] |
Star networks | The central switch | A redundant central switch, or a mesh or a ring with a redundancy protocol for critical segments[15] |
Industrial Ethernet | A single network path to a field device | PRP over two separate networks, or HSR in a ring[15] |
Control systems | A single PLC CPU | A redundant CPU pair with automatic switchover[16] |
Distributed software | A single leader or database node | An odd-sized quorum cluster that keeps operating while a majority of members survives[17], with spares across fault isolation boundaries[3] |
Safety instrumented systems | A single sensor or logic channel (1oo1, HFT 0) | A redundant 1oo2 (HFT 1) or other voted architecture[7] |
People and process | Established procedures not being followed[4], or recovery knowledge held by one person | Documented, practiced procedures and cross-trained staff |
The star network row is the textbook case. Every node communicates through the central switch, so its failure cuts all of them off from each other.
Recommended Reading: Star Topology: How It Works, Pros, Cons, and Uses
For the alternatives, its guides to ring topology and mesh topology. A plain ring is not free of single points of failure either: Wevolver's ring topology guide lists one among its limitations. Seamless ring redundancy with HSR is covered below.
Redundancy Patterns That Eliminate Single Points of Failure
Redundancy only removes a SPOF if the duplicate can take over the whole function, on its own, when the original fails. The patterns below differ in what they tolerate, how fast they recover, and what they cost.
N, N+1, N+2, 2N, 2(N+1) and 2(N+2) Capacity Redundancy
Schneider Electric's documentation on UPS system redundancy types gives precise definitions of the common configurations.[12]
Configuration | What can fail without dropping the load | How Schneider describes it |
N | Nothing. No redundancy, except optionally to the second power supply of each piece of equipment | One or more UPS modules working together to supply the IT load |
N+1 | Any one UPS module | Simple module redundancy: one module can be rendered inoperative or taken off-line |
N+2 | Any two UPS modules | Example: five modules connected to the IT load, with peak load never exceeding the capacity of three |
2N | An entire UPS group, or either of the two power supplies in an IT load | Two groups of four modules each, so N = 4; three groups of four, so N = 8 |
2(N+1) | An entire UPS group plus one more module from the remaining groups, or either of the two power supplies | Two groups of four modules each, so N = 3; three groups of four, so N = 6 |
2(N+2) | An entire UPS group plus two more modules from the remaining groups, or either of the two power supplies | Two groups of four modules each, so N = 2; three groups of four, so N = 4 |
In every redundant configuration, “N UPS modules will be able to support the peak IT load,” and “if the peak IT load is more than N can support, then system design redundancy will be lost.”[12] Load growth can silently turn an N+1 system back into an N system with a SPOF.
The difference between N+1 and 2N is where the SPOF moves. In N+1, if a load’s second power supply is connected at all, “both power supplies are connected to the group of UPS modules,”[12] so that group, and whatever sits upstream of it, is still shared. In 2N, two or three groups supply two different power supplies in each IT load, so an entire group can stop working and the equipment is still powered.[12]
The 2N family also constrains the build: the number of modules in each group must be the same, which is not required in N, N+1 or N+2.[12]
Uptime Institute's Tier Classification System applies the same thinking to whole facilities:[13]
Tier | What Uptime Institute describes | Single point of failure implication |
Tier I | The facility has to shut down completely for preventive maintenance and repairs | Protects against disruptions from human error, but not unexpected failure or outage |
Tier II | Redundant capacity components for power and cooling | An unexpected shutdown still affects the system |
Tier III | Concurrently maintainable, with redundant distribution paths | Any part can be shut down without impacting IT operation |
Tier IV | Several independent and physically isolated systems act as redundant capacity components and distribution paths | When a piece of equipment fails, or a distribution path is interrupted, IT operations are not affected |
Two Tier IV details matter for SPOF analysis. The separation "is necessary to prevent an event from compromising both systems," and "all of the IT equipment must have a fault-tolerant power design to be compatible."[13] Uptime also notes that when redundant components or distribution paths are shut down for maintenance, the environment may face a higher risk of disruption if a failure occurs.[13] Maintenance windows temporarily bring SPOFs back.
Active-Standby Failover: VRRP and Redundant Controllers
Many SPOFs are removed with an active unit and a standby that takes over. The default gateway is the classic network example. RFC 9568, which defines version 3 of the Virtual Router Redundancy Protocol (VRRP) and obsoletes RFC 5798, explains that a manually configured default route "creates a single point of failure. Loss of the default router results in a catastrophic event, isolating all end-hosts that are unable to detect an available alternate path."[14]
VRRP "is designed to eliminate the single point of failure inherent in a network utilizing default routing" by electing one router as the Active Router for a shared virtual address.[14] Its timers set the detection time. A Backup Router declares the Active Router down after the Active_Down_Interval, calculated as (3 × Active_Adver_Interval) + Skew_Time, where Skew_Time = ((256 − Priority) × Active_Adver_Interval) / 256.[14]
With the default advertisement interval of 1 second and the default backup priority of 100,[14] the calculation runs as follows:
Skew_Time = (256 − 100) × 1 s / 256 = 0.61 s.
Active_Down_Interval = 3 × 1 s + 0.61 s = 3.61 s.
That is consistent with the RFC's own figure of less than 4 seconds with the default interval, which it says is configurable to less than 1/25 second.[14] Faster is not automatically better: with a small interval, queuing delays on a VRRP router that is generating more packets than it can transmit can make a Backup Router promote itself, then switch back when the delayed advertisements arrive, and "this process can repeat many times per second, causing a significant disruption of traffic."[14]
Industrial controllers apply the same idea to the CPU. Siemens' S7-1500R/H redundant system "tolerates the failure of one of the two R- or H-CPUs in the PROFINET ring," and "the primary CPU and the backup CPU execute the user program in parallel."[16] In the October 2018 edition of the system manual, the specified switchover time is 300 ms for the CPU 1513R-1 PN and CPU 1515R-2 PN, which synchronize over the PROFINET ring, and 50 ms for the CPU 1517H-3 PN, which synchronizes over fiber-optic cable.[16] The manual defines switchover time as the time from failure of the primary CPU until the backup CPU takes over control of the process.[16]
Check that number against your process. If a loop cannot tolerate the switchover gap, a redundant controller pair on its own does not solve the problem. The H-system's fiber-optic synchronization also allows up to 10 km between the CPUs, depending on the synchronization module,[16] which makes it possible to install the two CPUs in separate rooms or buildings, out of reach of the same local fire or flood.
Seamless Redundancy: PRP and HSR
Active-standby failover always involves a switchover gap, however short. For industrial networks that cannot tolerate one, IEC 62439-3:2021 (Edition 4.0) specifies two protocols that, in the event of failure of any network element, provide "seamless switchover with zero recovery time."[15] The Parallel Redundancy Protocol (PRP) attaches nodes to two separate networks (nodes attached to only one network are allowed too, but they get no second path), while High-availability Seamless Redundancy (HSR) threads two-port nodes in a ring or multi-port nodes in a meshed network.[15]
The price of PRP is duplication: two separate networks instead of one.
Recommended Reading: Network Topology: 7 Types and How to Choose One
Quorum Clusters for Distributed State
Systems that hold shared state, such as configuration stores and cluster managers, often cannot simply run two independent active copies, because the copies could disagree. Many use consensus instead. The etcd documentation states that "an etcd cluster needs a majority of nodes, a quorum, to agree on updates to the cluster state."[17]
Cluster size | Majority needed | Failures tolerated |
1 | 1 | 0 |
2 | 2 | 0 |
3 | 2 | 1 |
4 | 3 | 1 |
5 | 3 | 2 |
7 | 4 | 3 |
Source: etcd FAQ.[17]
The table exposes a common trap. A two-node cluster needs both members for a majority, so it tolerates zero failures: each node is a single point of failure for updates.[17] Adding a member to bring the cluster to an even number "doesn't buy additional fault tolerance."[17] Bigger is not free either: etcd notes that a 5-member cluster, which tolerates two member failures, is enough in most cases, and that larger clusters pay for their extra fault tolerance with lower write performance.[17] Spreading members across regions puts them in separate failure domains, at the cost of higher consensus latency.[17]
The unit of failure matters as much as the count. The AWS whitepaper notes that because Availability Zones are fault isolation boundaries, "an entire AZ worth of Amazon EC2 instances can fail together."[3] Its example: a workload that needs 10 instances at peak can use two AZs with 10 instances each (20 in total), or three AZs with 5 each (15 in total), and both survive the loss of one AZ.[3]
Voting Architectures in Safety Instrumented Systems
Functional safety standards formalize redundancy as hardware fault tolerance. PR electronics' explanation of IEC 61508 architectural constraints puts it simply: "Hardware fault tolerance is the addition of redundant elements to allow for failures e.g. 1oo1 = HFT0, 1oo2=HFT1."[7] Standards impose these architectural constraints according to the safety integrity level (SIL) required, using HFT to complement claimed failure rates, because accurate and reliable failure rate data for electronic devices was historically very difficult to obtain.[7] Other voted arrangements exist too, such as two-out-of-three (2oo3), in which two of three channels must agree.
Recommended Reading: Functional Safety Foundations
Architectural constraints are only part of the picture. Meeting them "does not, in itself, prove target SIL achievement," because random hardware integrity and systematic capability must also be demonstrated.[7]
Nuclear protection systems add a maintenance rule. NRC Criterion 21 requires enough redundancy and independence that "no single failure results in loss of the protection function" and that "removal from service of any component or channel does not result in loss of the required minimum redundancy," unless the protection system’s acceptable reliability of operation can be otherwise demonstrated.[6] It also requires the ability to test channels independently "to determine failures and losses of redundancy that may have occurred."[6]
Common Cause Failures: When Redundancy Is Not Enough
Every redundancy calculation above assumes independent failures. Common cause failures (CCFs) break that assumption. NASA's Fault Tree Handbook defines them as "two or more component failures that occur at the same time or occur within a relatively short interval and that are due to a common cause."[2] Its examples:[2]
A common design or material deficiency that makes multiple components fail to perform a function or withstand a design environment.
A common installation error, such as check valves installed backwards and never tested after installation.
A common maintenance error, such as multiple valves left misaligned after maintenance.
A common harsh environment, such as vibration, radiation, moisture, or contamination.
The handbook's worked example shows the scale of the effect. For three redundant components, each with a failure probability of 1 in 1,000, the probability of all three failing independently is 1 in a billion (10⁻⁹).[2] If 1% of failures have a common cause dependency, the probability of losing all three becomes 10⁻³ × 10⁻² = 10⁻⁵, which is 10,000 times greater than the independent result.[2] Even a common cause probability of 1 in 1,000 would give 10⁻⁶, a factor of 1,000 above the independent case.[2]
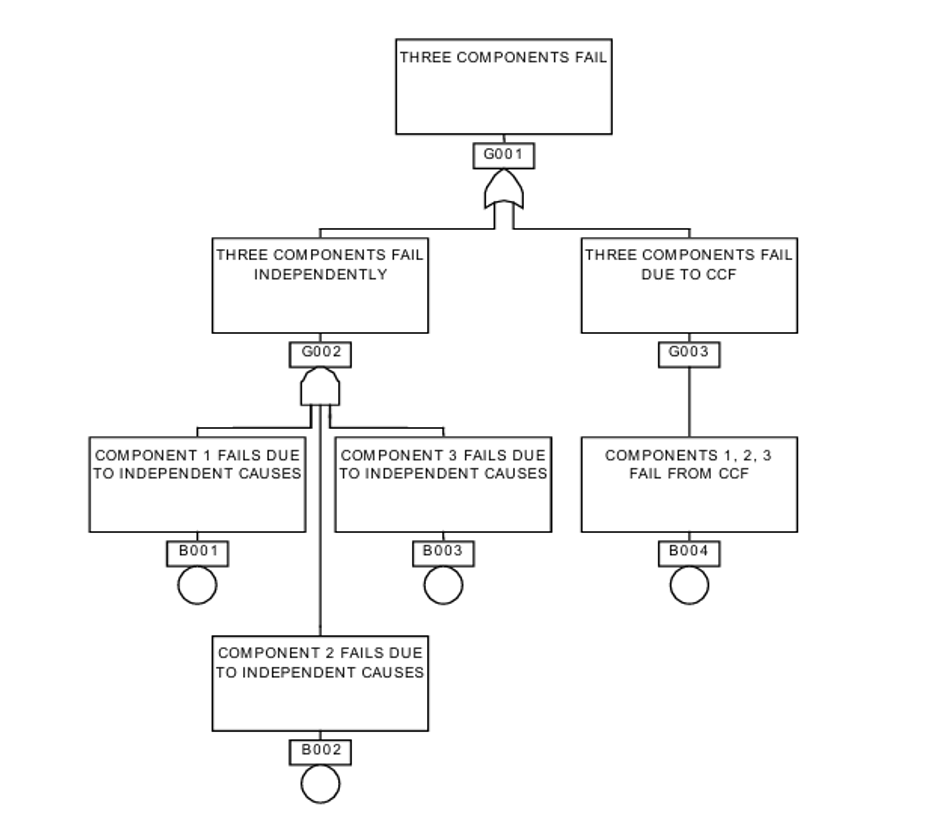
CCFs are generally more significant for active redundant components and become more dominant contributors as the number of redundant components increases.[2] The most common model for them is the beta factor model, in which β represents the fraction of the failure rate that is common to multiple susceptible components.[2] Neglecting CCF contributions "can result in a significant underestimate of the probability of the top event."[2]
Software Common Causes: Identical Code, Simultaneous Change
Identical software can turn every redundant copy into a candidate for the same failure at the same time. On 19 July 2024, CrowdStrike delivered a Rapid Response Content update to certain Windows hosts. “The sensor expected 20 input fields, while the update provided 21 input fields,” and that mismatch caused an out-of-bounds memory read, crashing the system.[18] Microsoft estimated that the update affected 8.5 million Windows devices, "or less than one percent of all Windows machines," and noted that "the broad economic and societal impacts reflect the use of CrowdStrike by enterprises that run many critical services."[19]
Redundant servers running the same agent and receiving the same update offered no protection against it, because the cause was shared. Among CrowdStrike's corrective actions were an updated deployment ring process, "ensuring Template Instances pass successive deployment rings before rollout into production," and additional customer control over how updates are deployed.[18] Staged rollouts are a defense against common cause failures, not only a release-management practice.
Defenses Against Common Cause Failures
Diversity. NRC Criterion 22 requires that "design techniques, such as functional diversity or diversity in component design and principles of operation, shall be used to the extent practical to prevent loss of the protection function."[6]
Physical separation. Uptime's Tier IV calls for independent, physically isolated systems, because "the separation is necessary to prevent an event from compromising both systems."[13]
Independent supplies. NRC Criterion 17 requires offsite power through “two physically independent circuits” designed and located to minimize, to the extent practical, the likelihood of their simultaneous failure while noting that "a switchyard common to both circuits is acceptable."[6] Even nuclear design rules accept a named shared element, as an explicit decision.
Fault isolation boundaries. Spread spares across boundaries that fail independently, such as instances, cells, Availability Zones, and regions.[3]
Staged change. Roll out software and configuration changes in rings, so a bad change hits a small share of the redundant set first.[18]
Design Trade-offs: When to Accept a Single Point of Failure
Eliminating every SPOF is rarely possible or affordable. Redundancy adds cost and complexity: a workload that uses spares "must know how to identify dependency failure, weight work away from it to a healthy resource, and manage overall capacity of the workload."[3] That failover logic is new code and new hardware that can fail. Uptime Institute makes the same point about automation in general: operators are investing in automation and control systems to manage complexity, but "more automation can cause different classes of problems."[4]
NASA's coverage model for fault-tolerant computers captures the risk. In that model, one exit represents single point failure, where a single fault causes the system to fail, “generally when an undetected error propagates through the system, or if the faulty unit cannot be isolated and the system cannot be reconfigured.”[2] A standby that has failed silently gives no protection. MIL-STD-1629A has a term for that risk: an undetectable failure is a postulated failure mode "for which there is no failure detection method by which the operator is made aware of the failure."[1]
When a SPOF stays, document why. NASA's general policy is not to permit retaining a single failure point unless special conditions, such as technology, operations, or cost, prohibit designing it out, and its retention rationale covers design, testing, inspection, failure history, and operational use.[5] The operational-use rationale includes factors such as flight rules and crew procedures, for example emergency stop features or special crew training.[5]
Common Mistakes and How to Avoid Them
Duplicating the box but not the path. Two power supplies fed from the same UPS group still share that group and everything upstream of it.[12] Trace every redundant pair back to where the paths merge.
Never testing failover. A redundant channel that has already failed is invisible until the day you need it. Design in the ability to test channels independently.[6]
Letting load growth erode redundancy. When peak load exceeds what N units can carry, the design redundancy is gone.[12]
Building two-node quorum clusters, or padding an odd cluster to an even size. A two-member cluster tolerates zero failures, and adding a member to reach an even number “doesn’t buy additional fault tolerance.”[17]
Tuning failover timers too aggressively. With a small advertisement interval, queuing delays can make VRRP routers flip between Active and Backup many times per second.[14]
Running identical software everywhere and changing it all at once. Stage changes through deployment rings.[18]
Forgetting people and procedures. The most common root of human-error outages is staff not following procedures that already exist.[4]
Analyzing once. Keep the FMEA and critical items list alive through the life of the system.[5]
Conclusion
A single point of failure is defined by a single cause, not a single component. The math is simple: in a series system every element is a SPOF and reliabilities multiply, while in a redundant system the failure probabilities of independent elements multiply. The hard part is the word "independent."
Find SPOFs with a bottom-up FMEA, a top-down fault tree, and a dependency map that crosses the system boundary. Remove them with the pattern that fits the function: N+1 or 2N capacity, active-standby failover, seamless PRP or HSR networking, odd-sized quorum clusters, or voted safety channels. Then attack common causes with diversity, separation, and staged change, test every failover path, and document the SPOFs you decide to keep.
FAQs
What is a single point of failure?
A single point of failure (SPOF) is an item whose failure would result in failure of the whole system and is not compensated for by redundancy or an alternative operating procedure.[1] Common examples are a lone power supply, a default gateway, a single PLC CPU, and a database with no replica.
What is an example of a single point of failure in a network?
The default gateway is the classic case. With a manually configured default route, loss of the default router isolates all end-hosts that cannot detect an alternate path.[14] VRRP removes this SPOF by letting a Backup Router take over the gateway's virtual address.[14] The central switch of a star network is another example.
How do you identify single points of failure?
Use FMEA to work bottom-up through every component and failure mode,[5] and fault tree analysis to work top-down from the loss of function. Every minimal cut set with one basic event is a single failure that alone causes the top event.[2] Add a dependency map for shared services such as power, cooling, signals, DNS, and authentication.
How do you eliminate a single point of failure?
Add redundancy that can carry the whole function independently: N+1 or 2N capacity,[12] active-standby failover such as VRRP[14] or redundant controllers,[16] seamless network redundancy such as PRP or HSR,[15] or an odd-sized quorum cluster of three or more members.[17] Then check for common causes that could take out both paths at once.[2]
What is the difference between N+1 and 2N redundancy?
N+1 adds one spare module to the group that carries the load, so any one module can fail.[12] 2N uses two or three groups of modules that feed two different power supplies in each load, so an entire group can fail and the equipment stays powered.[12]
Does redundancy guarantee high availability?
No. Redundancy delivers its calculated benefit only when failures are independent. In NASA's example, a common cause present in 1% of failures made losing three redundant components (each with a failure probability of 1 in 1,000) 10,000 times more likely than the independent calculation.[2] Untested failover, shared upstream paths, and simultaneous software changes also defeat redundancy.
What is a single point of failure in cloud computing?
In cloud computing, a SPOF can be a shared service rather than a server. In the October 2025 AWS US-EAST-1 event, an empty DNS record for DynamoDB's regional endpoint also made EC2 launches fail, because a process they relied on depended on DynamoDB.[11] Spreading spares across Availability Zones protects against the failure of a whole zone.[3]
References
[1] U.S. Department of Defense, “MIL-STD-1629A: Procedures for performing a failure mode, effects and criticality analysis,” Nov. 24, 1980. [Online]. Available: https://extapps.ksc.nasa.gov/Reliability/Documents/milstd1629_FMEA.pdf. Copy hosted by NASA Kennedy Space Center. [Accessed: Oct. 26, 2026].
[2] M. Stamatelatos, W. Vesely, et al., Fault Tree Handbook with Aerospace Applications, Version 1.1. Washington, DC: NASA Office of Safety and Mission Assurance, Aug. 2002. [Online]. Available: https://s3vi.ndc.nasa.gov/ssri-kb/static/resources/Fault%20Tree%20Handbook_NASA.pdf. [Accessed: Oct. 26, 2026].
[3] Amazon Web Services, “Availability with redundancy,” in Availability and Beyond: Understanding and Improving the Resilience of Distributed Systems on AWS, AWS whitepaper (archived for historical reference). [Online]. Available: https://docs.aws.amazon.com/whitepapers/latest/availability-and-beyond-improving-resilience/availability-with-redundancy.html. [Accessed: Oct. 26, 2026].
[4] Uptime Institute, “Uptime announces Annual Outage Analysis Report 2026,” press release, May 13, 2026. [Online]. Available: https://uptimeinstitute.com/about-ui/press-releases/uptime-announces-annual-outage-analysis-report-2026. [Accessed: Oct. 26, 2026].
[5] NASA Marshall Space Flight Center, “Identification, control, and management of critical items lists,” Preferred Reliability Practice No. PD-ED-1240, Oct. 1995. [Online]. Available: https://extapps.ksc.nasa.gov/reliability/Documents/Preferred_Practices/1240.pdf. [Accessed: Oct. 26, 2026].
[6] General Design Criteria for Nuclear Power Plants, 10 C.F.R. Part 50, App. A, U.S. Nuclear Regulatory Commission. [Online]. Available: https://www.ecfr.gov/current/title-10/chapter-I/part-50/appendix-Appendix%20A%20to%20Part%2050. [Accessed: Oct. 26, 2026].
[7] PR electronics, “SIL part 2: Architectural constraints,” PR Knowledge Library. [Online]. Available: https://www.prelectronics.com/support/pr-knowledge-library/tips-and-tricks/sil-part-2-architectural-constraints/. [Accessed: Oct. 26, 2026].
[8] NIST/SEMATECH, “8.1.8.2. Series model,” in e-Handbook of Statistical Methods. [Online]. Available: https://www.itl.nist.gov/div898/handbook/apr/section1/apr182.htm. [Accessed: Oct. 26, 2026].
[9] NIST/SEMATECH, “8.1.8.3. Parallel or redundant model,” in e-Handbook of Statistical Methods. [Online]. Available: https://www.itl.nist.gov/div898/handbook/apr/section1/apr183.htm. [Accessed: Oct. 26, 2026].
[10] Amazon Web Services, “Distributed system availability,” in Availability and Beyond: Understanding and Improving the Resilience of Distributed Systems on AWS, AWS whitepaper (archived for historical reference). [Online]. Available: https://docs.aws.amazon.com/whitepapers/latest/availability-and-beyond-improving-resilience/distributed-system-availability.html. [Accessed: Oct. 26, 2026].
[11] Amazon Web Services, “Summary of the Amazon DynamoDB service disruption in the Northern Virginia (US-EAST-1) region,” post-event summary, Oct. 2025. [Online]. Available: https://aws.amazon.com/message/101925. [Accessed: Oct. 26, 2026].
[12] Schneider Electric, “UPS system redundancy types,” EcoStruxure Power Monitoring Expert 2024 Help, last updated Jan. 9, 2024. [Online]. Available: https://product-help.se.com/docs/EcoStruxure/Power-Monitoring-Expert-2024/content/4_configuring/tools/ups_power_config_utility/ups_system_redundancy_types.htm. [Accessed: Oct. 26, 2026].
[13] Uptime Institute, “Tier Classification System.” [Online]. Available: https://uptimeinstitute.com/tiers. [Accessed: Oct. 26, 2026].
[14] A. Lindem and A. Dogra, “Virtual Router Redundancy Protocol (VRRP) version 3 for IPv4 and IPv6,” RFC 9568, Apr. 2024 (obsoletes RFC 5798). [Online]. Available: https://www.rfc-editor.org/rfc/rfc9568.html. [Accessed: Oct. 26, 2026].
[15] Industrial Communication Networks — High Availability Automation Networks — Part 3: Parallel Redundancy Protocol (PRP) and High-Availability Seamless Redundancy (HSR), IEC 62439-3:2021, Ed. 4.0, Dec. 15, 2021, incl. Apr. 2023 corrigendum. [Online]. Available: https://webstore.iec.ch/en/publication/64423. [Accessed: Oct. 26, 2026].
[16] Siemens AG, “SIMATIC S7-1500: S7-1500R/H redundant system,” System Manual, Ed. 10/2018, A5E41814787-AA. [Online]. Available: https://assets.new.siemens.com/siemens/assets/api/uuid:7506b4b1-8261-4942-9346-7c28d6951ff0/s71500rh-manual-en-us-en-us.pdf. [Accessed: Oct. 26, 2026].
[17] etcd, “FAQ,” etcd documentation, v3.7. [Online]. Available: https://etcd.io/docs/v3.7/faq/. [Accessed: Oct. 26, 2026].
[18] CrowdStrike, “Executive summary: Root cause analysis, Channel File 291,” Aug. 6, 2024. [Online]. Available: https://www.crowdstrike.com/wp-content/uploads/2024/08/Executive-Summary_Root-Cause-Analysis_Channel-File-291.pdf. [Accessed: Oct. 26, 2026].
[19] D. Weston, “Helping our customers through the CrowdStrike outage,” The Official Microsoft Blog, Jul. 20, 2024. [Online]. Available: https://blogs.microsoft.com/blog/2024/07/20/helping-our-customers-through-the-crowdstrike-outage/. [Accessed: Oct. 26, 2026].
[20] Functional Safety of Electrical/Electronic/Programmable Electronic Safety-Related Systems — Part 2: Requirements for Electrical/Electronic/Programmable Electronic Safety-Related Systems, IEC 61508-2:2010, Ed. 2.0, Apr. 30, 2010. [Online]. Available: https://webstore.iec.ch/publication/5516. [Accessed: Oct. 26, 2026].
in this article
1. Key Takeaways2. Introduction3. What Is a Single Point of Failure?4. Why Single Points of Failure Matter: Downtime, Cost, and Safety5. The Math: Why Series Systems Are Fragile and Redundancy Helps6. How Engineers Find Single Points of Failure7. Common Single Points of Failure by Domain8. Redundancy Patterns That Eliminate Single Points of Failure9. Common Cause Failures: When Redundancy Is Not Enough10. Design Trade-offs: When to Accept a Single Point of Failure11. Common Mistakes and How to Avoid Them12. Conclusion13. FAQs