LiFePO4 Voltage Chart: SOC & Voltages for 3.2V/12V/24V/48V Systems
This article explores the LiFePO4 voltage chart, covering SOC and voltage for 3.2V, 12V, 24V & 48V systems, charging and BMS cutoffs.

28 Jul, 2026. 14 minutes read
Introduction
Engineers and system integrators rely on an accurate LiFePO4 voltage chart when designing off‑grid solar systems, marine power systems and battery management hardware. Lithium iron phosphate (LFP or LiFePO₄) batteries behave differently from lead‑acid or 3.7 V lithium‑ion cells, so using the wrong chart can lead to mis‑configured chargers or premature pack shutdowns. Understanding these differences is critical when calibrating voltage‑based protections and interpreting state of charge.
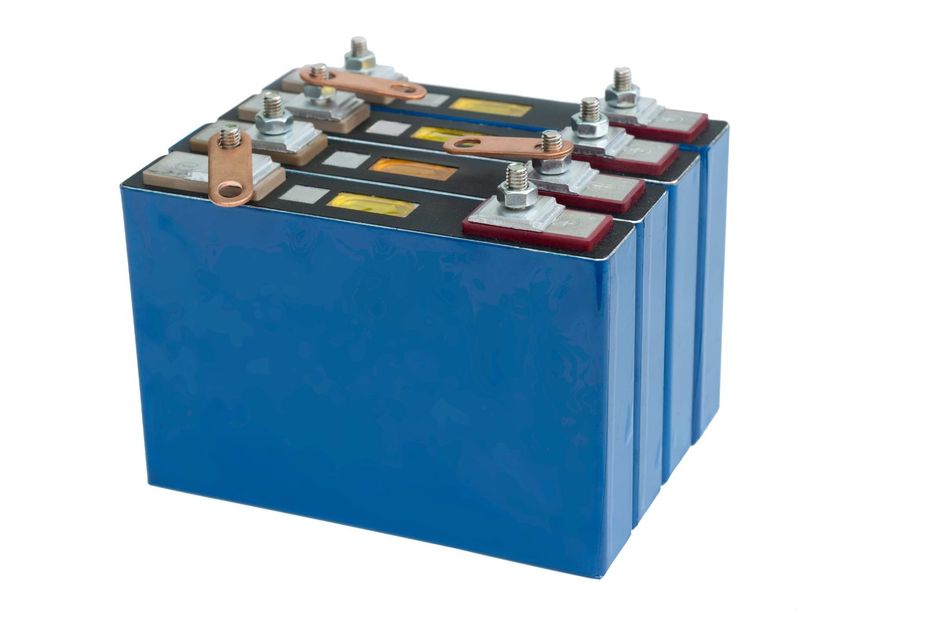
Compared with nickel‑manganese‑cobalt (NMC) lithium‑ion cells, LiFePO₄ has a lower energy density but offers superior thermal stability and cycle life. Lead‑acid batteries (flooded, AGM and GEL) have yet another set of voltages and a steep discharge curve, dropping from roughly 12.7 V at full charge to around 11.4 V when depleted [3]. This reference compiles open‑circuit voltages (OCV) and charging parameters for single cells and common pack voltages (12 V, 24 V and 48 V) across state of charge (SOC) percentages. It also explains why LiFePO₄ has a flat discharge curve, how to interpret loaded versus resting voltages, and what typical battery management system (BMS) protection limits look like. The charts and diagrams here are distilled from manufacturer data and industry guides.
What is LiFePO4?
LiFePO₄ (lithium iron phosphate) is a type of rechargeable lithium-ion battery chemistry. The name comes from its components:
Li is for lithium
Fe for iron
PO₄ for phosphate
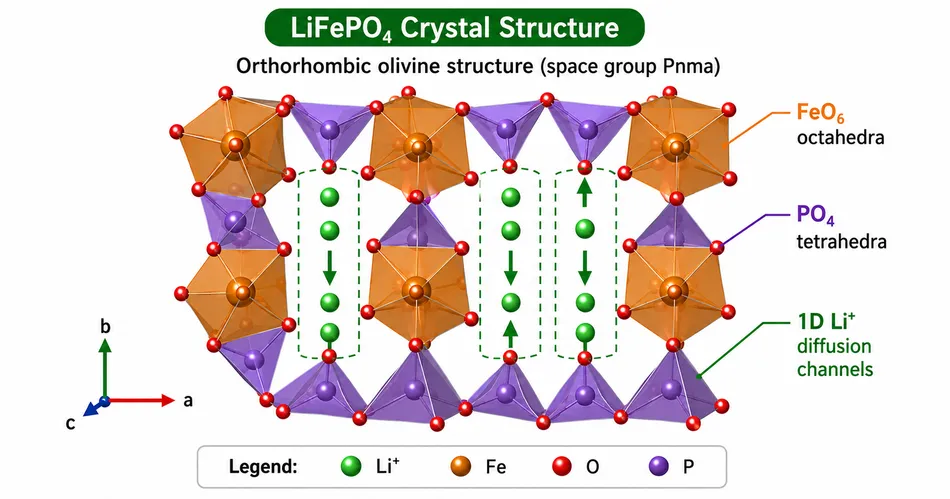
It uses a lithium iron phosphate cathode and a graphite anode, which is different from more common lithium-ion chemistries like NMC (nickel manganese cobalt) or LCO (lithium cobalt oxide) used in phones and laptops.
Key characteristics:
Lower nominal voltage: about 3.2 Volts per cell, vs. 3.6–3.7V for standard Li-ion.
Flat discharge curve: voltage stays fairly constant across most of its charge range, unlike lead-acid or standard Li-ion.
Longer cycle life: typically 2,000–6,000+ charge cycles vs. 500–1,500 for NMC.
Better thermal stability: much lower risk of thermal runaway/fire compared to NMC or LCO.
Lower energy density: stores less energy per kg than NMC, so packs are heavier/bulkier for the same capacity.
Tolerates deep discharge better: can handle 0–100% depth of discharge(DOD) more safely than lead-acid.
Common uses: solar/off-grid battery banks, RVs, marine systems like a trolling motor, electric vehicles (especially budget/standard-range EVs), and power tools, anywhere long lifespan and safety matter more than maximizing energy density.
Suggested Reading: What Is LiFePO4? Engineering Guide to Lithium Iron Phosphate Batteries
LiFePO₄ Voltage Behavior: Charging, Resting, and Discharge Characteristics
While LiFePO₄'s nominal voltage is 3.2 V per cell, the actual voltage characteristics vary significantly depending on charge state and measurement conditions; understanding these differences is essential for configuring chargers and BMS protection thresholds correctly.
Key terms:
OCV (Open-Circuit Voltage): the resting voltage of a cell with no load or charge current applied, measured after several hours of rest; the most reliable voltage-based SOC indicator.
Cutoff voltage: the threshold at which a BMS stops charging (over-voltage cutoff) or discharging (under-voltage cutoff) to protect the cell.
Charging, Resting, and Fully-Charged Voltage
The maximum voltage for LiFePO₄ is 3.65 V per cell [2]. A cell fresh off the charger may read 3.60–3.65 V, but this is inflated by surface charge; after several hours of rest, the voltage settles to a true resting value of around 3.30–3.35 V [1]. This distinction matters: measuring voltage too soon after charging will overestimate SOC.
The Flat Discharge Plateau
LiFePO₄'s discharge curve is characterized by a long, flat plateau: voltage remains near 3.3 V from roughly 90% down to 20% SOC [3]. Only at the end of discharge does voltage drop sharply toward the cutoff.
This plateau is why LiFePO₄ delivers stable power under load, but it also means voltage alone is a poor indicator of remaining capacity. For example, a change from 3.32 V to 3.27 V corresponds to a large swing in SOC, from 80% down to 60% [1,4]. In practice, coulomb counting and pack-integrated BMS measurements with app-monitoring provide far better SOC accuracy; voltage charts should be treated as coarse indicators only.
Protection Limits and Recommended Operating Range
LiFePO₄ tolerates deeper cycling than lead-acid; a recommended SOC range of 20–80% helps extend cycle life [9], though occasional full cycles are still needed to let the BMS recalibrate.
Overcharging by exceeding 3.65 V per cell, or holding a high voltage for extended periods, accelerates electrolyte degradation and lithium plating [2]. On the discharge side, the absolute discharge voltage cutoff is 2.5V per cell, below which electrode damage becomes a risk [1]; though most BMS units are configured with a safety margin, setting the practical undervoltage cutoff at 2.8–3.0 V per cell rather than the absolute limit. Every pack should include a BMS enforcing both over-voltage and under-voltage thresholds.
Discharge Curve Diagram
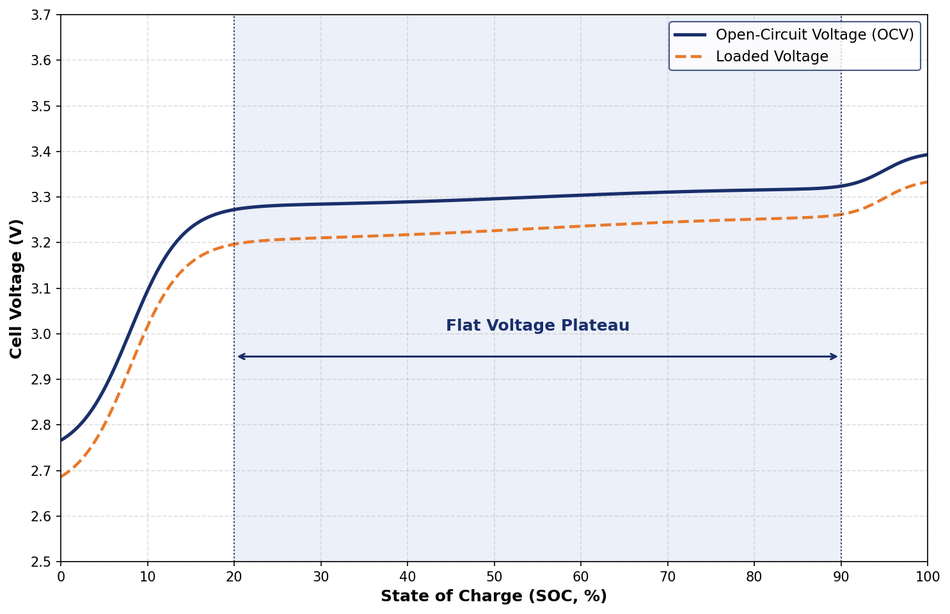
The figure illustrates the characteristic LiFePO₄ discharge curve for a single cell. Both the open‑circuit (resting) and loaded curves stay flat across most of the SOC range and only diverge significantly near the extremes.
What Is State of Charge (SOC)?
State of charge (SOC) is the remaining battery capacity, expressed as a percentage of full charge; 100% means fully charged, 0% means fully discharged. Voltage is simply one way to estimate SOC; it is not the same measurement, and for LiFePO₄ the two track each other only loosely.
As covered above, LiFePO₄'s flat discharge plateau means voltage barely changes across most of the SOC range. In practice, this makes voltage-based SOC readings fairly reliable near the extremes; below 20% and above 90% SOC, where the curve is steep, but far less precise in the 20–90% middle range, where a few hundredths of a volt can represent a 20% swing in actual capacity.
The tables below translate SOC into approximate resting voltages for a single cell and for common 12V, 24V, and 48V packs. Treat these as reference points for coarse estimation; for precise SOC tracking, pair them with coulomb counting or a BMS with integrated capacity monitoring.
Recommended Reading: Solid-State vs. Li-ion: Which Battery Tech is better for Electric Vehicles?
LiFePO₄ Cell Voltage Chart (3.2 V single cell)
The table below summarises typical open‑circuit voltages (OCV) at various states of charge for a single 3.2 V LiFePO₄ cell. The "Charging (top of charge)" column reflects the higher voltage seen when a charger holds the cell at constant voltage during the end of the bulk/absorption phase; this reading drops to the OCV value after the cell rests, ideally for several hours. A rough reading is possible after 30 minutes, but full stabilization can take longer. Values come from manufacturer charts and industry guides [1,4]; exact figures vary slightly by manufacturer. [1].
State of charge (SOC) | Charging (top of charge) | Resting open‑circuit voltage | Notes |
100 % | 3.60–3.65 V | 3.30-3.40 V | Full charge; rest several hours for an accurate reading [1] |
90 % | – | 3.35 V | End of upper plateau [1] |
80 % | – | 3.32 V | Common "full" reading when packs arrive from the factory [4] |
70 % | – | 3.30 V | Start of mid‑range plateau [1] |
60 % | – | 3.27 V | Mid‑range plateau [1] |
50 % | – | 3.26 V | Plateau continues [1] |
40 % | – | 3.25 V | Slight downward trend [1] |
30 % | – | 3.22 V | Lower plateau; plan to recharge soon [1] |
20 % | – | 3.20 V | Approaching knee; avoid long dwell [1] |
10 % | – | 3.00 V | Low; pack voltage sag becomes pronounced [1] |
0 % (cut‑off) | – | 2.50 V | Absolute manufacturer limit, most BMS units apply a safety margin and disconnect at 2.8–3.0V in practice; do not treat as usable capacity [1] |
Interpretation: When reading a cell's voltage with a multimeter, disconnect all loads and chargers and allow at least 30 minutes of rest. Measuring during charging or under load can mislead you by several hundred millivolts. The table above shows that the difference between 80 % and 30 % SOC is only ~0.1 V, so voltage‑based SOC estimation has limited resolution.
Note: exact values vary somewhat by manufacturer and cell design; treat this table as representative rather than universal.
12 V LiFePO₄ Voltage Chart (4S Configuration)
A 12 V LiFePO₄ battery consists of four 3.2 V cells in series, resulting in a nominal voltage of 12.8 V. Because pack voltage scales linearly with cell voltage, the open‑circuit voltages at each SOC can be approximated by multiplying the single‑cell values by four. The table below summarises typical voltages during charging and at rest for a 4S pack [1]. Data are corroborated by manufacturer guides such as EcoFlow and Renogy [7,8].
SOC (%) | Charging voltage range | Resting OCV | Comments |
100 % | 14.4–14.6 V | 13.2- 13.6 V | Charger holds pack at constant voltage during the end of bulk/absorption [1]. After resting, the voltage settles near 13.2- 13.6 V [7]. |
90 % | – | 13.4 V | Upper plateau; still near full [1]. |
80 % | – | 13.28 V | Approximated from 3.32 V per cell [1]. |
70 % | – | 13.20 V | Start of mid‑range plateau [1]. |
60 % | – | 13.08 V | Mid‑range plateau [1]. |
50 % | – | 13.04 V | Plateau continues; minor voltage change [1]. |
40 % | – | 13.00 V | Lower plateau; plan to recharge soon [1]. |
30 % | – | 12.88 V | Approaching knee [1]. |
20 % | – | 12.80 V | Equal to nominal rated voltage; do not mistake this reading for a full charge [1] |
10 % | – | 12.0 V | Low; BMS may reduce output to protect cells [1]. |
0 % (cut‑off) | – | 10.0 V | Absolute manufacturer limit; most BMS units apply a safety margin and disconnect earlier in practice. |
These values assume a resting battery at room temperature. Under heavy load or high discharge rates, the voltage may sag by 0.2–0.4 V due to internal resistance; at low temperatures it may sag further. Designers often set the inverter's low‑voltage disconnect a bit higher (for example, 11.0–11.5 V) to preserve battery life.
24 V LiFePO₄ Voltage Chart (8S Configuration)
A 24 V LiFePO₄ pack comprises eight 3.2 V cells in series (8S), yielding a nominal voltage of 25.6 V. Doubling the cell count roughly doubles the pack voltages listed for the 12 V configuration. The following table collates typical charging and resting values from multiple sources [1,7].
SOC (%) | Charging voltage range | Resting OCV | Notes |
100 % | 28.8–29.2 V | 26.4-27.2 V | Bulk/absorption stage; let battery rest before interpreting SOC [7]. |
90 % | – | 26.8 V | Upper plateau [1]. |
80 % | – | 26.56 V | Approximated from 3.32 V per cell [1]. |
70 % | – | 26.40 V | Plateau zone [1]. |
60 % | – | 26.16 V | Mid‑range plateau [1]. |
50 % | – | 26.08 V | Plateau continues [1]. |
40 % | – | 26.00 V | Lower plateau [1]. |
30 % | – | 25.76 V | Approaching knee [1]. |
20 % | – | 25.60 V | Equal to nominal rated voltage — do not mistake this reading for a full charge |
10 % | – | 24.0 V | Low; plan to recharge [1]. |
0 % (cut‑off) | – | 20.0 V | Absolute manufacturer limit; most BMS units apply a safety margin and disconnect earlier in practice [1]. |
Designers frequently set load disconnects at 22–23 V rather than using the absolute minimum voltage of 20, thereby keeping cell voltages above ~2.8 V and prolonging cycle life.
48 V LiFePO₄ Voltage Chart (16S Configuration)
A 48 V LiFePO₄ pack contains sixteen 3.2 V cells in series (16S) for a nominal voltage of 51.2 V. This configuration is common in home energy storage systems and off‑grid inverter‑charger setups. The table below compiles typical charging and resting voltages [1,7].
SOC (%) | Charging voltage range | Resting OCV | Comments |
100 % | 57.6–58.4 V | 52.8-54.4 V | Absorption stage at 3.60–3.65 V per cell [1]. |
90 % | – | 53.6 V | Upper plateau [1]. |
80 % | – | 53.12 V | Approximated from 3.32 V per cell [1]. |
70 % | – | 52.80 V | Plateau zone [1]. |
60 % | – | 52.32 V | Mid‑range plateau [1]. |
50 % | – | 52.16 V | Plateau continues [1]. |
40 % | – | 52.00 V | Lower plateau [1]. |
30 % | – | 51.52 V | Approaching knee [1]. |
20 % | – | 51.20 V | Still above cut‑off [1]. |
10 % | – | 48.0 V | Low; BMS may reduce output [1]. |
0 % (cut‑off) | – | 40.0 V | Under‑voltage disconnect for 16S pack [1]. |
Inverters and home energy storage systems often set cut‑offs at 44–46 V to avoid deep discharges and preserve cycle life. Keep in mind that temperature and load current influence measured voltages; always refer to the pack's datasheet for specific limits.
Charging Voltages: Bulk, Absorption, Float and Cutoff
Unlike lead‑acid batteries, LiFePO₄ does not require a multi‑stage absorption period. Charging is typically performed with a constant current during the bulk stage until the pack voltage reaches the bulk/absorption set‑point, followed by a constant‑voltage phase until the current tapers off. Over‑charging above 3.65 V per cell should be avoided because it accelerates degradation [2].
The table below summarises recommended charging parameters for different system voltages based on manufacturer guides [2,3]. Bulk and absorption voltages are often specified as ranges; choosing the lower end maximises cycle life, while the upper end achieves slightly more capacity.
Configuration | Bulk / Absorption voltage | Float voltage (maintenance) | Equalize | Notes |
3.2 V single cell | 3.55–3.65 V | 3.30–3.35 V | N/A | A float stage is optional; 3.30–3.35 V per cell maintains near‑full charge without stressing the chemistry [2]. |
12 V (4S) | 14.2–14.6 V | 13.2–13.4 V | N/A or 14.6 V | Many solar charge controllers provide a user‑defined lithium profile. Set re‑bulk at ~13.2 V so the charger restarts only when the pack drops below this level [2]. |
24 V (8S) | 28.4–29.2 V | 26.4–26.8 V | N/A or 29.2 V | Float is often disabled; if enabled, keep it near the resting full voltage [2]. |
48 V (16S) | 56.8–58.4 V | 52.8–53.6 V | N/A or 58.4 V | Avoid long floats at high voltage; low self‑discharge means occasional top‑offs suffice [2]. |
Why float is lower: holding LiFePO₄ cells at high voltage (≥13.6 V for a 12 V pack) for days can trigger lithium plating and swelling [2]. Thus float voltage should be kept around 3.30–3.35 V per cell (≈13.2–13.4 V for 4S) and charging should resume only when the voltage drops significantly (re‑bulk voltage). Equalization, which pulses high voltage to equalize voltage and de‑sulfate lead‑acid plates, is not needed for LiFePO₄ and is often disabled.
Loaded vs Resting Voltage
Voltage readings vary significantly between a resting battery and one under load or being charged. Under load, internal resistance causes the terminal voltage to sag; the magnitude of the sag depends on the current and cell impedance. Conversely, a cell fresh off the charger reads artificially high due to surface charge. UPower's guide recommends a simple measurement procedure: identify the chemistry, stop charging, remove loads, let the battery rest for at least 30 minutes, then measure the open‑circuit voltage [1]. Combining this reading with a proper LiFePO₄ chart provides a coarse SOC estimate.
For example, a fully charged 4S pack might read 14.6 V immediately after the charger stops; after a 30‑minute rest it will settle around 13.6 V [7]. Under a 0.5C load, the same pack could dip to 13.2 V while still at 90 % SOC. This behaviour underscores why voltage‑based SOC estimation is low resolution and why a coulomb counter (shunt‑based battery monitor) is recommended for accurate energy tracking [3].
BMS Thresholds and Protection Limits
A Battery Management System monitors individual cells and the pack to prevent over‑charge, over‑discharge, over‑current and temperature excursions. Typical voltage thresholds are summarised below using data from Anern's BMS settings guide [5] and other manufacturer specifications [10].
Parameter | Per‑cell threshold | 12 V pack (4S) | 48 V pack (16S) | Notes |
Charge cut‑off / over‑voltage | 3.55–3.65 V | 14.2–14.6 V | 56.8–58.4 V | When any cell exceeds this voltage, the BMS stops charging [5]. Many BMS units release the charge cut‑off once the cell falls back to ~3.55 V (13.8 V for 4S) [10]. |
Discharge cut‑off / under‑voltage | 2.5–3.0 V | 10.0–11.2 V | 40.0–44.8 V | If any cell drops below this range, the BMS disconnects the load [5]. Some BMS units reconnect when the cell voltage recovers above ~2.9 V [10]. |
Re‑bulk / recharge restart | ~3.3 V | ~13.2 V | ~52.8 V | Charger restarts when pack falls below this level [2]. |
Temperature limits | Block charge below 0 °C and above ~45 °C; disallow discharge below –20 °C or above ~60 °C | — | — | Many owners block charging below 0 °C and allow discharge down to –20 °C; high‑temperature charge limits are around 45 °C and discharge limits near 60 °C [5]. |
Cell balancing | Top balance at the end of charge | — | — | Balancing is most effective during the absorption phase when the charger holds at the bulk voltage; balancing sessions every few cycles keep cell voltages equal [5]. |
Properly configured BMS thresholds protect the pack without unduly limiting usable capacity. Designers should match the BMS settings to charger and inverter profiles and verify that contactors, fuses, and wire gauges can handle the maximum expected currents.
Recommended Reading: Optimizing Battery Performance: Advanced Management Systems for Enhanced Safety, Efficiency, and Utilization
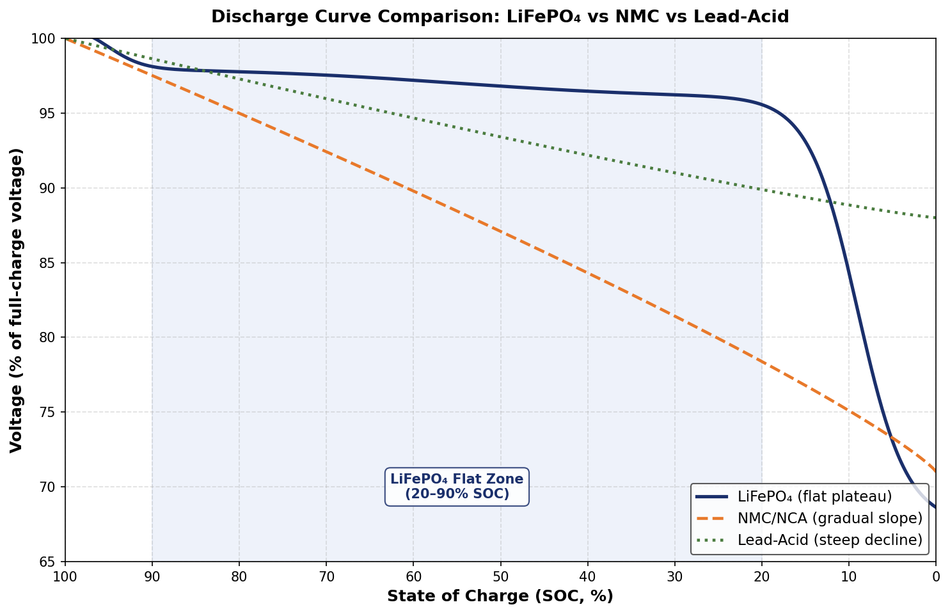
LiFePO₄ vs NMC vs Lead‑acid Voltage Curves
Understanding voltage differences between battery chemistries helps prevent mismatched chargers and misinterpreted SOC readings. The table below compares key voltage parameters and discharge characteristics of LiFePO₄, NMC (nickel‑manganese‑cobalt lithium‑ion), and lead‑acid batteries. NMC cells are commonly labelled 3.7 V; they charge to 4.2 V and discharge to about 3.0 V [6]. Lead‑acid voltages vary by type (flooded, AGM, GEL) but typically range from 12.7 V at full charge to 11.2 V when depleted [3].
Chemistry/ configuration | Nominal cell voltage | Full‑charge voltage | Nominal pack voltage (4S / 16S) | Discharge curve shape | Typical cut‑off |
LiFePO₄ (LFP) | 3.2 V | 3.60–3.65 V | 12.8 V / 51.2 V | Very flat plateau between 90–20 % SOC [3]; voltage changes little until the knee near 10 % SOC. | 2.5 V per cell (≈10 V for 4S) [1] |
NMC / NCA (3.7 V Li‑ion) | 3.6–3.7 V | 4.2 V | 14.8 V / 59.2 V (4S / 16S) | Sloping discharge: voltage drops from ~4.0 V at 80 % SOC to ~3.5 V at 25 % SOC and ~3.0 V at empty [6]. | 2.8–3.0 V per cell (≈11.2 -12 V for 4S packs) |
Lead‑acid (flooded/AGM/GEL) | 2.0 V per cell (12 V pack) | 2.4–2.45 V per cell (≈14.4–14.7 V) | 12 V / 48 V | Steep decline: a 12 V flooded battery drops from ~12.7 V at 100 % SOC to ~11.8 V at 40 % SOC and ~11.4 V at 0 % SOC [3]. | ≈1.75 V per cell (≈10.5 V for a 12 V pack) |
Limitations of Voltage‑based SOC Estimation
Voltage‑based SOC tables provide useful reference points for system sizing and troubleshooting. However, relying solely on voltage to gauge remaining capacity can be misleading. The primary reasons are:
Flat plateau: LiFePO₄'s voltage plateau means that a 0.1 V change could represent a change from 80 % to 30 % SOC [1]. Without a shunt or coulomb counter, it is difficult to differentiate between these points.
Load‑dependent sag: Voltage under load drops due to internal resistance and temperature. High discharge currents can push the terminal voltage into the cut‑off region even when significant capacity remains, causing premature inverter shutdown.
Surface charge: Immediately after charging, the voltage is higher than the equilibrium OCV; failing to allow a rest period can lead to over‑estimating SOC [2].
Temperature effects: Cold temperatures reduce voltage and available capacity, while high temperatures increase voltage; charts are typically based on room‑temperature measurements.
Cell imbalance: In multi‑cell packs, one weak cell may reach the cut‑off voltage earlier than the average, triggering the BMS even though the overall pack voltage appears safe.
For high‑resolution SOC monitoring, engineers should integrate a shunt‑based battery monitor or use the coulomb‑counting capabilities of the BMS. Voltage charts remain valuable for quick checks and to ensure that chargers and inverters are set within safe ranges, but they should be supplemented with more precise instrumentation.
Conclusion
The LiFePO₄ or LFP battery has become the preferred choice for many off‑grid, marine and renewable applications because of its flat discharge curve, high cycle life and robust safety profile. This reference presented detailed voltage charts for single cells and 12 V, 24 V and 48 V packs, along with recommended charging parameters, BMS protection thresholds and comparative data against NMC and lead‑acid chemistries. The tables demonstrate that LiFePO₄ voltages change little over most of the SOC range, highlighting both the benefit (stable output) and the challenge (low‑resolution SOC estimation). Combining voltage measurements with coulomb counting and proper BMS configuration ensures reliable and long‑lived battery systems.
Frequently Asked Questions (FAQs)
At what voltage is a 12 V LiFePO₄ fully charged?
A 12 V (4S) LiFePO₄ battery is considered fully charged when the charger holds it at 14.4–14.6 V during the absorption phase, and then the voltage settles to about 13.6 V after resting [7]. Always measure after a 30‑minute rest for accuracy.
What voltage indicates a dead 12 V LiFePO₄ battery?
Most BMS units cut off a 4S pack at about 10.0 V (2.5 V per cell) [1]. For longevity, set your inverter's low‑voltage disconnect higher (around 11.0–11.5 V) to avoid deep discharges.
Why is my LiFePO₄ voltage flat around 13.2 V?
LiFePO₄ batteries exhibit a flat plateau between roughly 90 % and 20 % SOC. A resting voltage around 13.2–13.4 V simply indicates that the battery is somewhere in the middle of its capacity; voltage alone cannot pinpoint the exact SOC [3].
How do I calculate SOC from voltage?
First, disconnect all loads and chargers and allow the battery to rest for at least 30 minutes. Measure the open‑circuit voltage and compare it to the appropriate LiFePO₄ chart. Remember that the resolution is coarse; a coulomb counter or shunt monitor provides more accurate SOC data [3].
What is the difference between resting and loaded voltage?
Resting voltage is measured after the battery has been disconnected from charging or load for a period of time, allowing surface charge to dissipate. Loaded voltage is measured while the battery is powering a load, and it is lower due to internal resistance and current draw. Use resting voltage for SOC estimation; loaded voltage is useful for inverter cut‑off settings.
Can I use a lead‑acid charger on LiFePO₄?
Generally no. Lead‑acid chargers often include an equalization stage that pulses voltage above 15 V, which can damage LiFePO₄ cells. If using a lead‑acid charger, ensure it has a programmable lithium profile or disable equalization and adjust bulk and float voltages to lithium‑safe values [2].
What voltage damages a LiFePO₄ cell?
Charging above 3.65 V per cell or discharging below 2.5 V per cell risks permanent damage [1,5]. High temperatures (>45 °C) during charging can also accelerate degradation [5]. Always configure the BMS and charger to stay within these limits.
References
[1] UPower, "Ultimate guide to lithium-ion battery voltage chart (3.7 V, LiFePO4, 12 V/24 V/48 V)," UPower. [Online]. Available: https://udpwr.com/blogs/portable-power-station-knowledge/ultimate-guide-to-lithium-ion-battery-voltage-chart. [Accessed: Jul. 27, 2026].
[2] EV-Lithium, "The ultimate guide to LiFePO4 float voltage: Settings for 12V, 24V & 48V systems," EV-Lithium. [Online]. Available: https://www.evlithium.com/Blog/lifepo4-battery-float-voltage-guide.html. [Accessed: Jul. 27, 2026].
[3] Clever Solar Power, "LiFePO4 voltage charts (1 cell, 12 V, 24 V, 48 V)," Clever Solar Power. [Online]. Available: https://cleversolarpower.com/lifepo4-voltage-chart/.
[4] EVE Mall, "LiFePO4 state of charge chart & discharge curve," EVE Mall. [Online]. Available: https://evemall.eu/blog/lifepo4-state-of-charge-chart/.
[5] Anern Store, "LiFePO4 BMS settings for safe, long service," Anern Store. [Online]. Available: https://anernstore.com/blogs/diy-solar-guides/lifepo4-bms-settings.
[6] Ufine Battery, "Lithium battery voltage chart: 3.2 V vs 3.7 V vs 4.2 V," Ufine Battery. [Online]. Available: https://www.ufinebattery.com/blog/lithium-battery-voltage-chart/.
[7] EcoFlow, "Guide to LiFePO4 voltage chart," EcoFlow. [Online]. Available: https://www.ecoflow.com/us/blog/lifepo4-voltage-chart.
[8] Renogy, "A comprehensive LiFePO4 voltage chart guide for off-grid solar," Renogy. [Online]. Available: https://www.renogy.com/blogs/general-solar/lifepo4-voltage-chart.
[9] EG Batt, "LiFePO4 cycle life and recommended SOC range," EG Batt. [Online]. Available: https://www.egbatt.com/blogs/guide/lifepo4-cycle-life.
[10] LiFePO4 Battery Shop, "LiFePO4 battery voltage chart guide: No more confusion about battery voltage," LiFePO4 Battery Shop. [Online]. Available: https://www.lifepo4batteryshop.com/blogs/lifepo4-battery-voltage-chart-guide.
in this article
1. Introduction2. What is LiFePO4?3. LiFePO₄ Voltage Behavior: Charging, Resting, and Discharge Characteristics4. What Is State of Charge (SOC)?LiFePO₄ Cell Voltage Chart (3.2 V single cell)6. 12 V LiFePO₄ Voltage Chart (4S Configuration)7. 24 V LiFePO₄ Voltage Chart (8S Configuration)8. 48 V LiFePO₄ Voltage Chart (16S Configuration)9. Charging Voltages: Bulk, Absorption, Float and Cutoff10. Loaded vs Resting Voltage11. BMS Thresholds and Protection Limits12. LiFePO₄ vs NMC vs Lead‑acid Voltage Curves13. Limitations of Voltage‑based SOC Estimation14. Conclusion15. Frequently Asked Questions (FAQs)16. References