Investigating the carbon implications of AM-enabled distributed production of spare parts in the automotive industry
A student write-up that tries to compare the environmental impact and complexity of manufacturing automobile parts through conventional methods and modern distributed manufacturing techniques like 3D printing.

02 Jul, 2022. 10 minutes read
This article is a part of our University Technology Exposure Program. The program aims to recognize and reward innovation from engineering students and researchers across the globe.
I propose to evaluate the benefits of distributed manufacturing, specifically additive manufacturing, on carbon footprint and logistical complexity. A simple case study would be the potential of additively manufacturing (i.e. 3d-printing) spare parts in the automotive industry. Instead of keeping tooling on hand and shipping repair parts across the U.S., the idea would be that these spare parts could be printed closer to the end consumer, with an on-demand supply model. Thus, this approach would lower the need for transportation of final products and inventory.
This project will follow the methods taught in the course. Namely, the analysis is built on a product's carbon footprint [1] quantifying the extraction of raw materials, manufacturing, and transport to consumers. We intentionally exclude final reuse, recycling or disposal to highlight the differences in upstream supply chain-related carbon emissions between these two supply models.
Literature review
The energy consumption associated with raw material extraction [2] and processing of manufacturing materials are quantified in various textbooks [3]. For the energy consumption of the manufacturing process itself, data is publicly available from the U.S. Energy Information Administration [4]. The U.S. Environmental Protection Agency (EPA) also published values on the direct emissions of stationary combustion sources, which will be used to approximate manufacturing processes not included in the EIA reports [5]. These sources include the environmentally-related costs of metal casting, which is a traditional manufacturing process.
For additive manufacturing specifically, a large body of literature exists [6]–[9] discussing the environmental impacts and energy consumption of various processing techniques, including laser powder bed fusion. The recyclability of additively manufacturing parts could be an interesting dimension to discuss, but will not be covered in my analysis [10].
Emissions and costs associated with holding items in stock are described in our textbook, Section 8.1.2 [11]. Concerning specifically the usage of AM for producing spare parts, there are several studies that mention this use case [12], [13], albeit without extensive data available on the inventory-related implications.
Pump-to-wheel GHG emissions from fuel consumption are tabulated in [14], in addition to the emissions factors provided in assignment 1 with the WidgetCo case study. Barring the discovery of publicly available material and product transportation costs for AM-enabled spare parts, the simulation results of Li et al. 2017 could be used to estimate the carbon footprint of transporting spare parts [15].
Methods
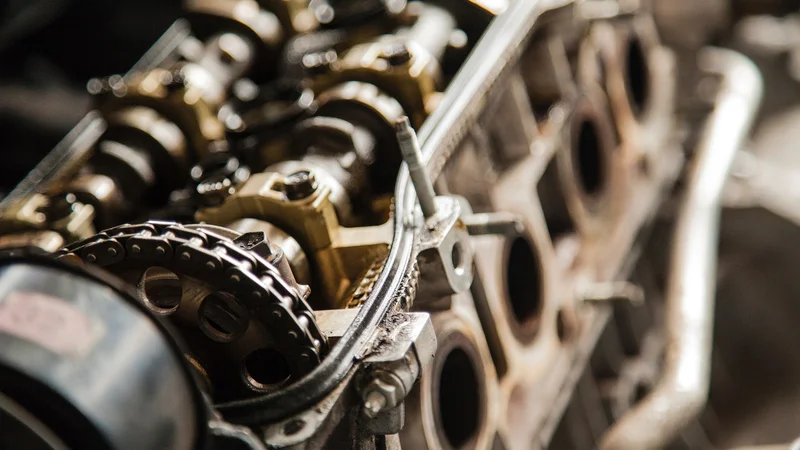
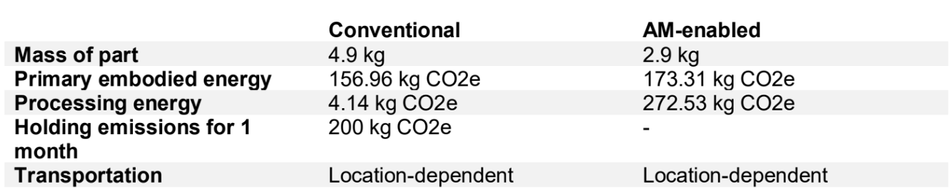
For this case study, we take the example of a metal brake caliper for the Bugatti Chiron [16]. Conventionally, this component weights 4.9kg and is machined out of aluminum. The additively manufactured version weights 2.9kg and is produced on an SLM 500 machine, in a job that takes 45 hours. Its dimensions are approximately 41cm x 21 cm x 13.6 cm (for length, width, height, respectively).

Material production and processing
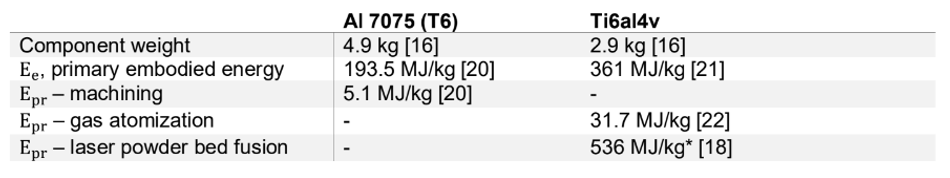
The energy associated with material production (Emat, MJ/kg) is calculated as:

where Ee is the primary embodied energy of the material in MJ/kg and Epr is the processing energy of the material in MJ/kg [17]. Input values are shown in Table 1. Note that the processing energy Epr associated with laser powder bed fusion can vary widely across multiple orders of magnitudes (i.e. 20 – 4800 MJ/kg), depending on the material and AM platform [7], [18], [19], and therefore could be a significant source of error within the model.
Inventory management
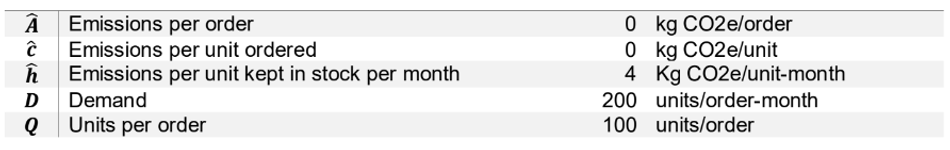
To approximate carbon emissions associated with holding inventory, a simple, single-Echelon, EOQ (economic order quantity) model is used. This model considers a singular inventory location and Product. Demand D is constant and continuous per time unit [11]. The average emissions per time unit E(Q) is given as

where AÂ is the emissions per placed order, cĉis the emission per unit ordered, h is the emission per unit kept in stock per month, and QQ is the quantity ordered [11], [23].
Transportation
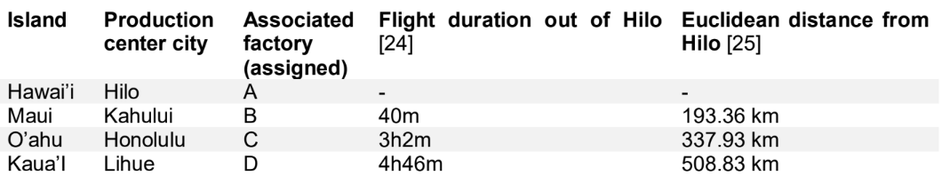
For this example, we consider the Hawaiian Islands. For the conventional supply chain, we assign a production and distribution center to Hilo, HI, a major city on the Big Island. Components are produced in Hilo, then transported to the consumer through a combination of ocean, air, and truck. Rail transport is not considered because the infrastructure is not present on the islands. For the AM supply chain, we assign a production center to each of the eight islands (Hawaiʻi, Maui, Oʻahu, Kauaʻi, and Niʻihau). Components will be produced at the nearest center, then transported to the end-use consumer by truck. Implicitly, this implies that the component will be produced on the same island as the consumer, such that ocean and air transportation will not be necessary. Due to their smaller size and lack of major airports, the islands of Kahoʻolawe, Lānaʻi, Molokaʻi, and Ni’ihau are not considered.
The analysis proceeds under the following assumptions and constraints:
This project compares supply chains that produce a single spare part on demand
For the conventional supply chain, parts are produced at Factory A, then transported to the customer by truck
For the conventional supply chain, demand is assumed to be constant, continuous and known
For the AM-enabled distributed supply chain, parts are produced at the factory (i.e. Factories A-D) closest to the customer, then transported to the customer by truck
Although highly influential, the impacts of terrain factors and topography are not considered within the scope of this analysis
The emissions associated with recycling and product packaging are also not considered.
The emissions for air transport are accordingly:

where Eair is the emissions of air transport, EE1 are the emissions associated with take-off and landing in kg CO2, E1 is the emissions factor associated with air travel, dd is the distance traveled in km, W is the shipment weight in kg, W1 is the aircraft maximum payload in kg, and λ1 is the aircraft payload utilization for the specific trip as a percentage [26]. The distance traveled between islands is approximated as

Where d is the distance traveled by boat in km and dEucis the Euclidean distance between cities (see Table 3). The factor of 1.3 accounts for changes in course due to obstacles (i.e. coasting around other islands) or sailing conditions. The emissions for road transportation are estimated using an activity- based model considering weight and distance, but not topography.

where Eroad is the emissions of road transport, E2 is the emissions factor associated with road transport in kg of CO2/km, dd is the distance traveled in km, W is the shipment weight in kg, W2 is the vehicle maximum payload in kg, and λλ2is the vehicle payload utilization for the specific trip as percentage [26]. The emissions for ocean transport are estimated as 0.019 kg CO2/km, i.e. the emissions of a single passenger on a ferry [27]. This estimate is used in lieu of a more established ocean freight model due to the relatively small size and distance associated with transport between islands.
Total carbon emissions
The total carbon emissions for conventional fulfillment by air include: primary embodied energy of aluminum, processing energy associated with machining, holding/inventory emissions, transport by air to the target island, and last-mile transportation by truck to the end user.
The total carbon emissions for conventional fulfillment by ocean include: primary embodied energy of aluminum, processing energy associated with machining, holding/inventory emissions, transport by ocean to the target island, and last-mile transportation by truck to the end user.
The total carbon emissions for fulfillment by distributed AM production include: primary embodied energy of titanium, processing energy associated with gas atomization and selective laser melting, and last-mile transportation by truck to the end user.
Results
For this simulation, 35 “orders” of the brake component were simulated randomly. For each order, an island and the distance between its main city and the final customer were randomly selected. The distance was thresholded between 0 and 250 km, accounting for the relatively small size of the islands. Aside from transportation-related emissions, the
The overall carbon emissions for each of the 35 samples are shown in Figure 2. Across all data points, the additively manufactured supply chain has higher carbon emissions. Conventional fulfillment with ocean transport has the lowest carbon emissions.

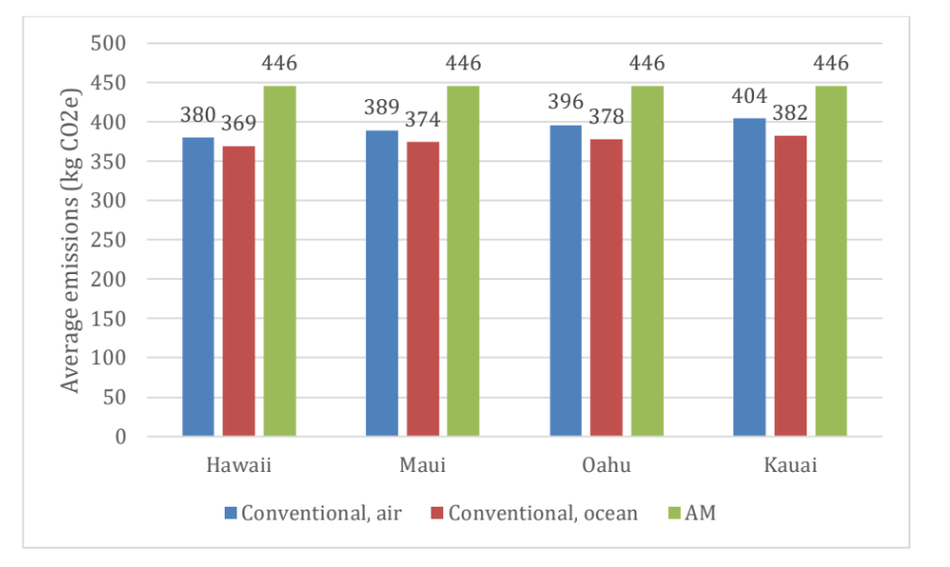
The carbon emissions per island (i.e. delineated by the island of the end consumer) is shown in Figure 3. The total carbon emissions trends with distance from Hawai’I (Big Island) for conventional fulfillment with air or ocean interisland transport. Nevertheless, the overall trend holds: AM-enabled product has the highest amount of carbon emissions, followed by conventional with air travel, then ocean.
Conclusion
Foremost, as expected, my analysis shows that while last-mile transportation CO2 costs are less using an additive manufacturing-based approach, there are other increased carbon costs, such as increased embodied energy of the material, and increased processing energy requirements for printing.
Therefore, while there may be alternative benefits to switching to additive-based approaches for spare part fulfillment, careful consideration should be given to the emissions profile of such supply chains. For spare parts that are needed infrequently, or that could be produced in ways that are less carbon-intensive, this AM-enabled approach might be more attractive.
Additionally, this case study has some notable limitations. Future implementations might be expanded to include:
- A full catalog of spare parts, instead of a singular part
- Impact of topology, driver behavior, and vehicle behavior in estimating truck transportation - A more nuance estimation of distance
- Consideration of different geographic contexts, such as the mainland U.S.
References
[1] T. Boukherroub, Y. Bouchery, C. J. Corbett, J. C. Fransoo, and T. Tan, “Carbon Footprinting in Supply Chains,” Springer Ser. Supply Chain Manag., vol. 4, pp. 43–64, 2017, doi: 10.1007/978- 3-319-29791-0_3.
[2] Y. Bouchery, C. J. Corbett, J. C. (Jan C. Fransoo, and T. Tan, “Sustainable supply chains : a research-based textbook on operations and strategy,” p. 517.
[3] S. Kalpakjian and S. Schmid, Manufacturing engineering and technology, SI 6th Edition. 2013. [4] U. Energy Information Administration, “2018 Manufacturing Energy Consumption Survey,” Accessed: Apr. 06, 2022. [Online]. Available: https://www.eia.gov/consumption/manufacturing. [5] U. Environmental Protection Agency, “Greenhouse Gas Inventory Guidance Direct Emissions from Stationary Combustion Sources,” 2016, Accessed: Apr. 06, 2022. [Online]. Available: www.epa.gov/climateleadership.
[6] K. Ma, T. Smith, E. J. Lavernia, and J. M. Schoenung, “Environmental Sustainability of Laser Metal Deposition: The Role of Feedstock Powder and Feedstock Utilization Factor,” Procedia Manuf., vol. 7, pp. 198–204, 2017, doi: 10.1016/J.PROMFG.2016.12.049.
[7] Z. Y. Liu, C. Li, X. Y. Fang, and Y. B. Guo, “Energy Consumption in Additive Manufacturing of Metal Parts,” Procedia Manuf., vol. 26, pp. 834–845, Jan. 2018, doi:
10.1016/J.PROMFG.2018.07.104.
[8] M. Baumers, C. Tuck, R. Wildman, I. Ashcroft, E. Rosamond, and R. Hague, “Transparency Built-in: Energy Consumption and Cost Estimation for Additive Manufacturing Baumers et al. Energy and Cost Estimation for Additive Manufacturing,” J. Ind. Ecol., vol. 17, no. 3, pp. 418– 431, 2013, doi: 10.1111/j.1530-9290.2012.00512.x.
[9] K. Kellens, M. Baumers, T. G. Gutowski, W. Flanagan, R. Lifset, and J. R. Duflou, “Environmental Dimensions of Additive Manufacturing: Mapping Application Domains and Their Environmental Implications,” J. Ind. Ecol., vol. 21, pp. S49–S68, Nov. 2017, doi: 10.1111/JIEC.12629.
[10] A. E. O. Daraban et al., “A deep look at metal additive manufacturing recycling and use tools for sustainability performance,” Sustain., vol. 11, no. 19, Oct. 2019, doi: 10.3390/SU11195494.
[11] J. Marklund and P. Berling, “Green Inventory Management,” Springer Ser. Supply Chain Manag., vol. 4, pp. 189–218, 2017, doi: 10.1007/978-3-319-29791-0_8.
[12] C. Lindemann, U. Jahnke, M. Moi, and R. Koch, “Analyzing product lifecycle costs for a better understanding of cost drivers in additive manufacturing,” 23rd Annu. Int. Solid Free. Fabr. Symp. - An Addit. Manuf. Conf. SFF 2012, pp. 177–188, 2012.
[13] E. Atzeni and A. Salmi, “Economics of additive manufacturing for end-usable metal parts,” Int. J. Adv. Manuf. Technol. 2012 629, vol. 62, no. 9, pp. 1147–1155, Feb. 2012, doi: 10.1007/S00170-011-3878-1.
[14] A. J. Craig, E. E. Blanco, and C. G. Caplice, “Carbon Footprint of Supply Chains: A Scoping Study,” Carbon Footpr. Supply Chain. A Scoping Study, Nov. 2013, doi: 10.17226/22524. [15] Y. Li, G. Jia, Y. Cheng, and Y. Hu, “Additive manufacturing technology in spare parts supply chain: a comparative study,” Int. J. Prod. Res., vol. 55, no. 5, pp. 1498–1515, 2017, doi: 10.1080/00207543.2016.1231433.
[16] B. Jackson, “SLM Solutions metal 3D printing brakes the most powerful car in Bugatti history - 3D Printing Industry,” 2018. https://3dprintingindustry.com/news/slm-solutions-metal-3d printing-brakes-powerful-car-bugatti-history-127878/ (accessed May 05, 2022).
[17] G. Ingarao, P. C. Priarone, Y. Deng, and D. Paraskevas, “Environmental modelling of aluminium based components manufacturing routes: Additive manufacturing versus machining versus forming,” J. Clean. Prod., vol. 176, pp. 261–275, Mar. 2018, doi:
10.1016/J.JCLEPRO.2017.12.115.
[18] M. Baumers, C. Tuck, R. Wildman, I. Ashcroft, and R. Hague, “Energy Inputs to Additive Manufacturing: Does Capacity Utilization Matter?,” 2011, Accessed: May 05, 2022. [Online]. Available: https://repositories.lib.utexas.edu/handle/2152/88336.
[19] H. S. Yoon et al., “A comparison of energy consumption in bulk forming, subtractive, and additive processes: Review and case study,” Int. J. Precis. Eng. Manuf. Technol. 2014 13, vol. 1, no. 3, pp. 261–279, Feb. 2015, doi: 10.1007/S40684-014-0033-0.
[20] P. C. Priarone, V. Lunetto, E. Atzeni, and A. Salmi, “Laser powder bed fusion (L-PBF) additive manufacturing: On the correlation between design choices and process sustainability,” Procedia CIRP, vol. 78, pp. 85–90, Jan. 2018, doi: 10.1016/J.PROCIR.2018.09.058.
[21] S. C. T. Norgate, T.E.; Rajakumar, V.; Trang, “Titanium and other light metals - Technology pathways to sustainable development,” 2004, doi:
http://hdl.handle.net/102.100.100/189832?index=1.
[22] M. Baumers, C. Tuck, R. Wildman, I. Ashcroft, and R. Hague, “Shape Complexity and Process Energy Consumption in Electron Beam Melting: A Case of Something for Nothing in Additive Manufacturing?,” J. Ind. Ecol., vol. 21, no. S1, pp. S157–S167, Nov. 2017, doi: 10.1111/JIEC.12397.
[23] G. Hua, T. C. E. Cheng, and S. Wang, “Managing carbon footprints in inventory management,” Int. J. Prod. Econ., vol. 132, no. 2, pp. 178–185, Aug. 2011, doi: 10.1016/J.IJPE.2011.03.024. [24] “Rome2rio: discover how to get anywhere.” https://www.rome2rio.com/ (accessed May 05, 2022).
[25] “Distance Between Cities Places On Map Distance Calculator.” https://www.distancefromto.net/ (accessed May 05, 2022).
[26] E. E. Blanco and Y. Sheffi, “Green Logistics,” Springer Ser. Supply Chain Manag., vol. 4, pp. 147–187, 2017, doi: 10.1007/978-3-319-29791-0_7.
[27] “What is the Carbon Footprint of Sea Freight and Ferries? – Travelinho.” https://www.travelinho.com/en/blog/carbon-footprint-sea-transport/ (accessed May 05, 2022).
About the University Technology Exposure Program 2022
Wevolver, in partnership with Mouser Electronics and Ansys, is excited to announce the launch of the University Technology Exposure Program 2022. The program aims to recognize and reward innovation from engineering students and researchers across the globe. Learn more about the program here.