Adopting Lean Manufacturing Principles and Learning Factory Concepts for Productivity Optimization
The study is about the transformation of the manual assembly process of medical test kits by integrating the learning factory and digital twin. Lean manufacturing principles and lean thinking are introduced to revamp value-added activities; reduce waste and level-load human utilization.

05 Jul, 2022. 14 minutes read
This article is a part of our University Technology Exposure Program. The program aims to recognize and reward innovation from engineering students and researchers across the globe.
Abstract
In parallel with the introduction of Industry 4.0 and the blooming of digitalization and machine learning, many companies are gradually transforming from conventional into a smart factory. Learning factory is a replica of the actual manufacturing environment and the digital twin which is a subsidiary of Industry 4.0 technology has been widely utilized. Learning factory provides an open platform for users to adopt proven good practices in manufacturing to their production, while digital twin is a virtual representation constructed to accurately reflect a physical object or process [1]. Lean manufacturing concepts and lean thinking have been actively practiced by enterprises to meet customer satisfaction and execute profitably.
Lean manufacturing is closely tied to value and waste, while lean thinking promotes respect for people and value on efforts from associates. The case study is focused on the transformation of the manual assembly process of medical test kits by integrating the learning factory and digital twin. In this study, lean manufacturing principles and lean thinking are introduced to revamp value-added activities; reduce wastes and level-load human utilization. Firstly, a detailed computational model of manufacturing is designed using simulation software to identify the shortfalls of current production or process and establish areas for improvement. Secondly, the targeted improvements such as reconfiguration of factory layout; streamlining of production flow; reset on supply material capacity. Thirdly, the results gained from these improvement efforts are evaluated quantitatively by comparing statistics before and after the enhancement activities.
Introduction
Lean management concept
Lean manufacturing started with the philosophy adopted from the Toyota Production System (TPS), which focuses on the elimination of wastes and improvement on value-added activities [2]. An enterprise needs to stay competitive in the market by offering good prices and fast delivery, without compromising on product quality. With the elimination of wastes, the available resources are channeled to value-added activities such as value generation (in product and services), improvement activities or in employees’ skills and knowledge upgrading activities. Lean manufacturing helps the company to explore many opportunities with the removal of non-value activities and wastes. Lean thinking not only improves processes but also believes in respect for people [3]. The effort from employees is valued with the people factor taken into consideration while assigning work tasks. This encourages speak-up culture and improves ownership of employees, which eventually helps in creating more value for the organization and to customers.
James P. Womack and Daniel T. Jones introduced Lean with the five key principles of lean – value, value stream, flow, pull and perfection [4] [5]. Value (in specific products or services) is what the customers are willing to pay for. Value Stream maps all activities including value-added and non-value activities, which are necessary to transform inputs to outputs; helps in identifying activities that do not add value (waste), and elimination of wastes. Flow is to make flow continuously by creating a tight and integrated sequence, allowing the product to flow smoothly to the customer. With the introduction of flow, the next is to let customers Pull value from upstream to downstream activities. Perfection refers to pursuing the continuous process of improvement and striving for perfection. In the process of identifying and analyzing waste, the need to understand the eight types of waste in Lean is important. Lean manufacturing defines eight types of waste within an operation; seven were originally conceived by TPS, with the eighth added when Lean methodology was adopted. They are defects, overproduction, waiting, non-utilized resource, transportation, inventory, motion and extra-processing. The removal of these wastes in the value stream of the specific processes helps to create more time for value-added activities that creates value for the customers.
Learning Factory
The learning factory features a realistic production environment for education, training and research in manufacturing [6]. For example, in SIMTech, the model factory features experiential experiments and learning of digitalization technologies for Industry 4.0 in an actual production environment. To advocate business development, sustainability and competitiveness, the manufacturing enterprises are continually improving their processes and operations. Several companies are gradually transforming from conventional into a smart factory. The model factory introduces state-of-the-art technology available in the market to individuals or industries for their factory transformation project. The trainees will learn and experience different technologies, thereafter, adopt proven good practices in manufacturing to their production. Besides that, there is an increasing number of learning factories in academic education facilities, institutes and companies with many focuses on lean production [7]. Lean manufacturing focuses on delivering value to the customer with the elimination of waste and optimizing the process. It offers a good platform for potential companies or industries, which have just started their journey in waste reduction and efficiency improvement [8]. Learning factory provides a better learning experience in which theoretical knowledge can be transformed into expertise and cultivate tenable learning effects.
Digital twin
A digital twin is one of the major Industry 4.0 applications. It was attributed to Michael Grieves and his work with John Vickers of NASA, Grieves proposed the digital twin as a virtual representation of a physical product containing information about said product, underlying product life-cycle management [9]. The definition of a digital twin has been expanded, it consists of three elements – a physical product, a virtual representation of that product and the bidirectional physical-to-virtual connection. To put it briefly, the digital twin is a virtual representation of a real-time digital counterpart of a physical process or object [10]. A virtual computational model is constructed by inputting data related to the object of interest; the replicated model is then simulated to predict operating effects, states and behaviors [11]. The virtual model can be employed to study opportunities for operational improvements and analyze the establishment of new technology in current production.
A huge room of freedom and flexibility can be possessed by the end-user for numerous trialand-error without affecting their current manufacturing process. In this case study, the simulation software used allows the user to construct a virtual production environment, containing information of the product to be manufactured. Hence facilitates analysis and decision-making. The simulation tool is aligned with learning factory concepts, and it helps to ascertain the benefits of a proposed layout, which could quickly generate the result for analysis and decision before making the actual changes to the work area layout. It acts as a time saver since various ideas and proposals can be stimulated without affecting the actual production and the results can be obtained at a shorter time. By integrating lean concepts into the simulation, the data of interest such as travel distance and utilization can be developed and used for continuous improvement
Case study and software simulation
Background and case study set up
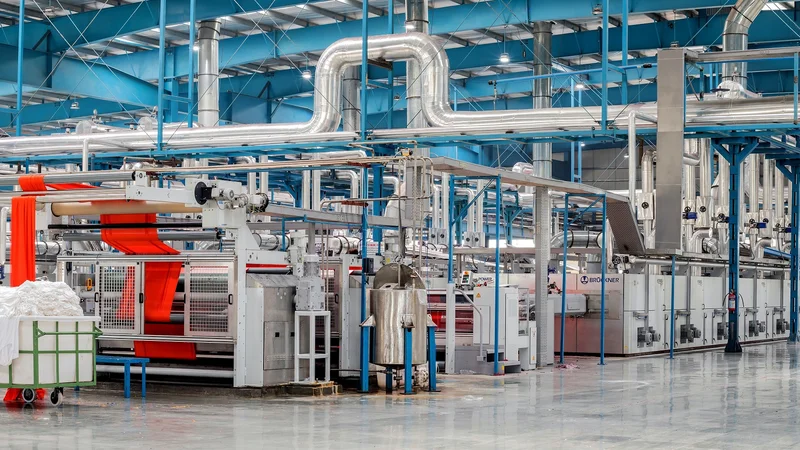
Coronavirus disease is a worldwide life-changing event. It has impacted the global economy; demand for healthcare support; and industry performance. Many countries, companies and individuals need to make changes to accommodate and live along with the situation. The expertise from different industries strives hard to control the spreading and find solutions to resolve this pandemic. Vaccine, swab test kit and antigen rapid test self-test kit are quickly developed. As the number of cases is increasing with the formation of new variants, it is observed that the market demand for COVID-19 related devices is exponentially increasing. The case study is focused on the assembly of an antigen rapid test self-test kit – a quick screening tool that allows individuals to screen themselves for COVID-19. It is a simple and easy test kit that can be performed at anytime and anywhere. The results can be shown within a short period.
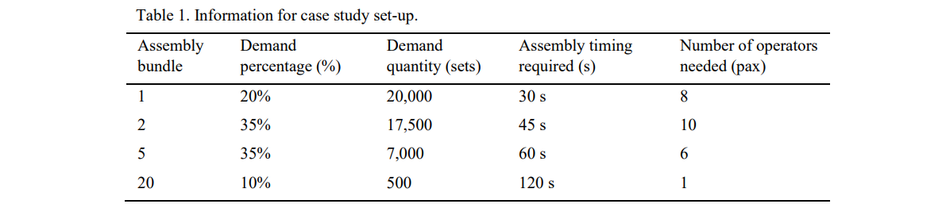
There are a few test kit manufacturers and suppliers available in the market, for an instance, Abbott Panbio, Quidel QuickVue and SD Biosensor. Straits Times reported that two local Singapore companies can produce 2.8 million test kits a month or with a maximum capacity of 100,000 test kits per day [12]. The case study is performed based on 100,000 daily production demand, involving four different bundles – a bundle of one, two, five and twenty. The raw materials include shelf carton, test card, reagent tube, sampling swab, Instructions for Use (IFU) and shelf label. These raw materials are placed near to the operators such as with rack behind the operators, with not much automation due to the urgency of setting up the assembly of test kits and the need for flexibility. To understand the value for customers, interviews and questionnaires with pharmacies have been conducted. It is noticed that bundles of two and five have the highest demand (35%), followed by a bundle of one (20%) and a bundle of twenty (10%). The reason is, an individual usually purchases a bundle of one or two for self-usage and occasionally a bundle of five for family usage. In addition, companies and institutes usually distribute bundles of two and five for employees and students for their weekly routine testing.
The purchase for a bundle of twenty is relatively lesser as the targeted customer is narrower due to concerns about the expiry date. An individual will purchase a bundle of twenty only when they have a bigger family group or for sharing purposes. For this case study, the assembly timing required for each bundle of test kitsis finalized by averaging the manual assembly timing required from three individuals. Concerning the daily production demand of 100,000 test kits, demand percentage for each bundle and assembly timing required for every bundle, the preliminary number of operators required for the manual assembly process could be obtained from calculation (see Table 1). The current production layout is set up based on typical manual assembly layout in the industry. The data generated based on the common practice in the industry will be analyzed; planned for future improvement via digital twin.
Current production layout
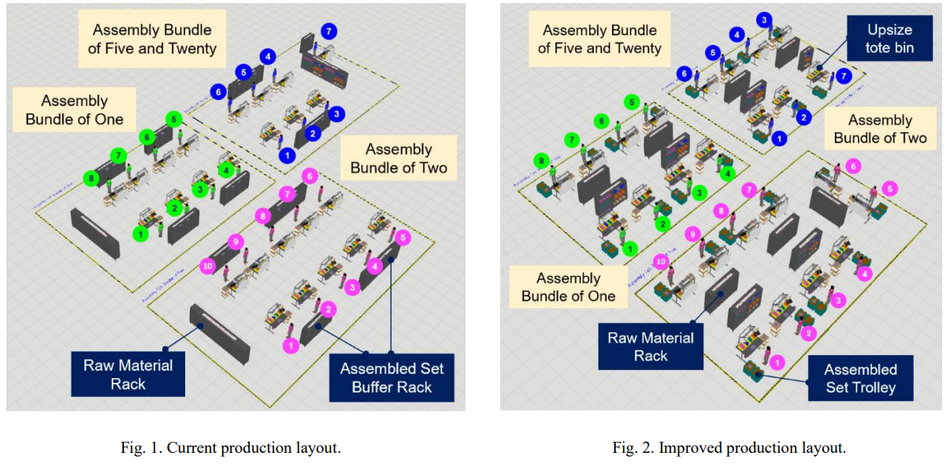
The manual assembly environment (see Figure 1) has been constructed with simulation software. There is a total of three assembly cells – assembly bundle of one; assembly bundle of two; assembly bundle of five and twenty. To ensure daily production compliance of 100,000 test kits, a total of twenty-five operators are required. The simulation is generated based on the assumptions of eleven working hours per shift, which excluded meal hours and short breaks. The target utilization rate is to be not more than 88%, with allowance factors of about 12% to 15% catered for personal needs, fatigue and other allowances. The standard size tote-bin for each component is placed at the workstation of each operator, upon finishing up the components in the tote-bin, the operator will retrieve raw materials from the racking.
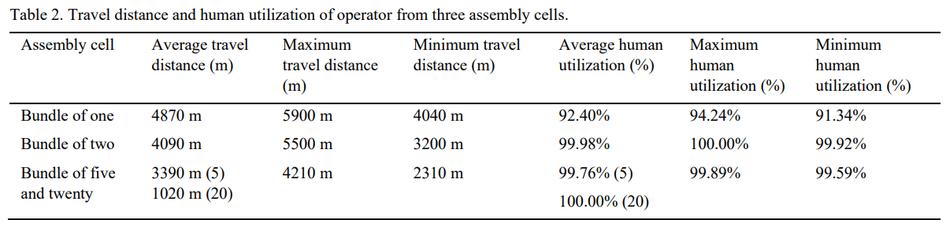
The raw material rack is located at each assembly cell for raw material storage. There is an assembly set buffer shelf for the operator to place assembled test kit set. Based on the results gained from simulation (see Table 2), it is presented that the average travel distance by the operator in an assembly bundle of one is 4870 m, with a maximum of 5900 m and a minimum of 4040 m. The average human utilization of operators is 92.40%, which ranges between 91.34% and 94.24%. As the raw material rack is located on the left, it is observed that operator 1 and 8 has a lesser travel distance compared to operator 4 and 5, which are stationed at the furthest end from the raw material rack. In general, the operator travel distance for this assembly cell increases corresponding to the distance between the operator workstation and raw material rack. The operator utilization is beyond the target utilization rate as they are working at an average of 92.40% utilization rate. For an assembly bundle of two, the operator travels an average of 4090 m within one shift, ranging from 3200 m to 5500 m. The operator travel distance increases alongside the distance between the workstation and raw material rack, which is the same as the assembly bundle of one. However, it is observed that for the completed kit shelf, which is shared by three operators, the distance travelled by the middle operator is the least amongst the three of them. For instance, operator 4 travelled lesser than operator 3 and 5. This is due to the shelf being located directly behind the operator, thereby a shorter travel distance. The operators in this assembly cell are fully tied up, they are working at almost 99.98% utilization rate, with a maximum of 100.00% and a minimum of 99.92%.
The raw material rack for the assembly bundle of five and twenty is located on the right, thus, operator 3 and 4 has a lesser travel distance compared to operator 1 and 6. The operator for a bundle of five has an average travel distance of 3390 m, varying from 2310 m to 4210 m, while the operator accountable for a bundle of twenty has a travel distance of 1020m. The difference in travel distance is significant amongst the operator in a bundle of five cells since all assembly cells are using standard tote-bin, which can store the same quantity of components at the workstation. The replenishment of tote-bin is faster for a bundle of five, compared to a bundle of one and two. The operators are fully tied up for both bundles of five and twenty, they are working at a utilization rate closing to 100.00%. A bundle of five operators has a maximum utilization of 99.89% and minimum utilization of 99.59%; whereas the operator in charge of a bundle of twenty hit a utilization rate of 100.00%.
Improved production layout
Upon analyzing the data obtained from the simulation, a few areas for improvement have been identified and proposed actions for resolving the issue. Firstly, it is noticed that uneven travel distance contributed by raw material shelf located at one end of the assembly cell. A lesser travel distance for those stationed near to the shelf; a longer travel distance for those who are stationed further from the shelf. Secondly, the distance travelled by the middle operator is the least amongst the three operators who share the same completed test kit shelf. Thirdly, the differences in travel distance are significant amongst the operator in a bundle of five cells, as a result of frequent replenishment required. Lastly, all operators are working beyond the target utilization rate of not more than 88%. It may cause a high risk to production, as a result of any operator slowing down their pace or any unforeseen hiccups, it will lead to misses in production target.
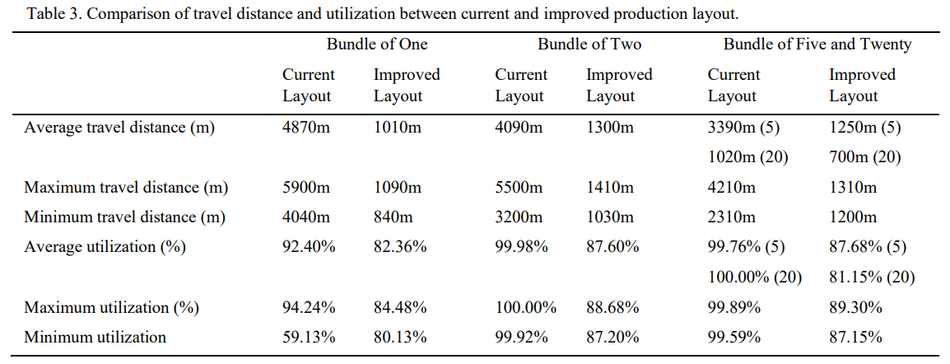
In addition, overloading workers could lead to fatigue after long working hours and eventually impact their performance or attendance. In the improved production layout (see Figure 2), three improvement actions have been taken with the elimination of motion waste. Foremost, relocate raw material shelf and set up sharing shelf for every two operators, instead of sharing of one raw material shelf which located at one end of each assembly cell. This has helped to ease travel distance amongst operators and further reduce motion waste. Furthermore, setting up assembled set trolley and located beside every workstation. The operator does not have to move or turn around to place assembled kits. The tote-bin for assembly bundle of five and twenty has been up-sized. This has increased the components contained in the tote-bin and thereby reduce the frequency for replenishment. The improved production layout is simulated and the results obtained are compared with the current production layout (see Table 3).
It is weighed from a reduction in travel distance and human utilization to comply with the target utilization rate. For the assembly bundle of one, there is an average reduction of 3860 m or equivalently to 79.30% reduction of travel distance. In the improved production layout, the operator has an average walking distance of 1010 m, ranging from 1090 m and 840 m. Utilization of operator has been reduced from 92.40% to 82.36%, with a 10.90% reduction. The operator has a better workload balance and meets the total allowance factor. There is an average reduction of 2790 m or equivalently 68.20% of travel distance for the operators working at the bundle of two. The operator has an average walking distance of 1300 m, ranging from 1410 m and 1030 m. The utilization rate has been reduced from 99.98% to 87.60%, with a 12.40% reduction. The utilization rate is now varying from 87.20% to 88.68%. For assembly bundle of five, it is seen an average reduction of 2140 m or equivalently 63.10% of travel distance, while a reduction of 320 m or equivalently 31.30% of travel distance for the operator working at assembly bundle of twenty. The utilization of operators working at assembly bundle of five has been reduced from 99.76% to 87.68%, with a 12.08% reduction, whereas the utilization rate for assembly bundle of twenty has been reduced from 100.00% to 81.15%, with an 18.85% reduction. In short, the operators who are accountable for three assembly cells have a remarking reduction in travel distance and meet the target allowance factor of not more than 88%.
Discussion and conclusion
As the COVID-19 situation and test kit demand is unpredictable and may not be long term, most of the manufacturers have set up the manual assembly production within a short period of them and they may have a reserve to invest for converting the process from manual to automated. The intention for investment might be very minimal. Some other proposals for improvements such as material transfer using an automated guided vehicle (AGV), conveyor system or kitting operator to transfer raw material to assembly operator can be introduced to construct a more robust production environment. Nevertheless, all of these require investment costs and time.
In summary, by adopting the concept of lean principles which focused on what value to create for the customers, the manual assembly environment is set up based on the customers‘ requirement of bundles one, two, five and twenty. The processes are streamlined and optimized with the elimination of waste. This case study is mainly aimed at motion waste. The elimination of waste helps to create a better flow from the input of material to the assembly of test kits. A digital twin enabled simulation software is used and acted as a confirmation on the proposed improvement with the solution created with the lean principles in mind. Based on results generated from simulation, it can be seen that there is a significant reduction in motion waste and in level loading of the operator. With both the lean principles and the usage of the digital twin, the pursuit of perfection can continue. For instance, the physical production environment of the Learning Factory with the developed simulation model of the case study could be set up to confirm the validity of the simulated data and process improvements and to step-up the research in the field of the digital twin. Moreover, the further improvement for the case study and simulation could have included the total value stream process, starting from material supply to finished goods delivery to the finished good warehouse.
Hence, it helps to provide a better overview to see how each function can help with one another. With the inclusion of all other activities, most wastes can be identified, analysed and eliminated. In addition, the didactic of the lean principles and the digital twin in a learning factory serves to create a real learning environment for students and industry.
References
[1] What is a digital twin?, Retrieved January 6, 2022, from https://www.ibm.com/sg-en/topics/what-is-a-digital-twin.
[2] P. Smith, Introduction to Lean Manufacturing Guest Lecture Carnegie Mellon University Australia Guest Lecture, Shinka Management, 2014.
[3] Mia Ljungblom, Thomas Taro Lennerfors, The Lean principle respect for people as respect for craftsmanship, International Journal of Lean Six Sigma, (2021) 1209-1214.
[4] Daniel, D, What is lean manufacturing?, (2020), Retrieved January 06, 2022, from https://searcherp.techtarget.com/definition/leanproduction.
[5] James Womack, Daniel Jones, Lean Thinking, Simon & Schuster, New York, 1996
[6] Abele E, Chryssolouris G, Sihn W, Metternich J, Elmaraghy H, Seliger G, Sivard G, Elmaraghy W, Hummel V, Tisch M, Seifermann S, Learning Factories for future-oriented research and education in manufacturing (in German), Cirp Annals – Manufacturing Technology, 66 (2) (2017) 803-826.
[7] Matthias Goerke, Maurice Schmidt, Jan Busch, Peter Nyhuis, The 5th Conference on Learning Factories 2015; Holistic Approach of Lean Thinking in Learning Factories, Procedia CIRP 32 (2015) 138–143.
[8] Christoffer Rybski, Roland Jochem, 6th CLF - 6th CIRP Conference on Learning Factories, Benefits of a learning factory in the context of lean management for the pharmaceutical industry, Procedia CIRP 54 (2016) 31–34.
[9] David Jones, Chris Snider, Aydin Nassehi, ason Yon, Ben Hicks, Characterising the Digital Twin: A systematic literature review, CIRP Journal of Manufacturing Science and Technology, 29 (2020) 36-52
[10] Elisa Negri, A review of the roles of Digital Twin in CPS-based production systems, Procedia Manufacturing, 11 (2017) 939-948.
[11] Benjamin Schleich, Nabil Anwer, Luc Mathieu, Sandro Wartzack, Shaping the digital twin for design and production engineering, CIRP Annals – Manufacturing Technology, 66 (2017) 141–144.
[12] Khalik, S, S'pore makers of covid-19 art kits having difficulty applying for approval for retail use, (2021), Retrieved December 18, 2021, from https://www.straitstimes.com/singapore/health/local-makers-having-difficulty-applying-for-approval-for-retail-use-of-covid-19-art.
About the University Technology Exposure Program 2022
Wevolver, in partnership with Mouser Electronics and Ansys, is excited to announce the launch of the University Technology Exposure Program 2022. The program aims to recognize and reward innovation from engineering students and researchers across the globe. Learn more about the program here.