Optical Integration Without Compromises
With an increased focus on home health, wellness, and prevention, a new market has been born around smart devices for tracking several vital parameters.
24 Jan, 2024. 10 minutes read
ADPD188GG optical subsystem.
This article was authored by By János Pálhalmi and Jan-Hein Broeders from Analog Devices.
Introduction
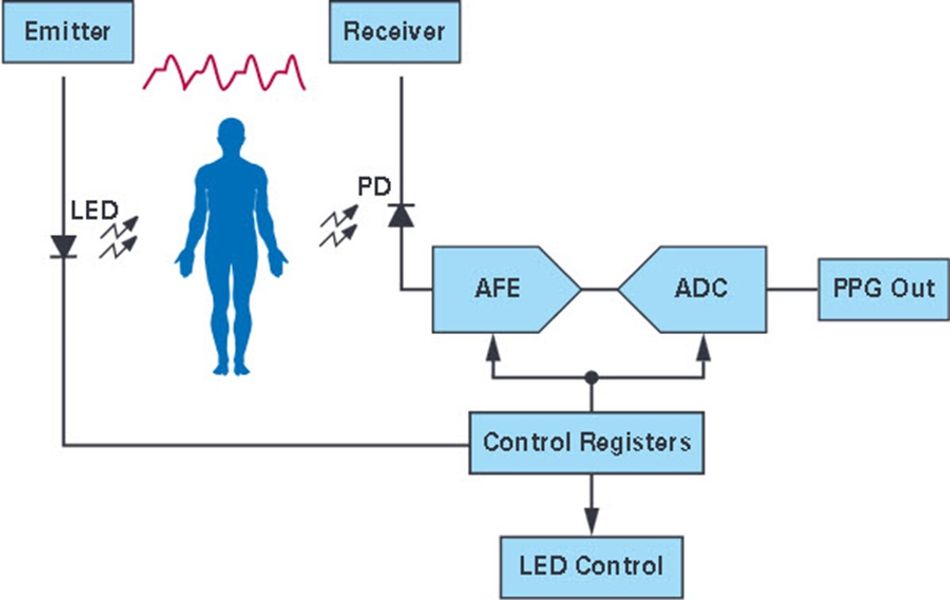
Photoplethysmography (PPG) is a common technology for measuring oxygen saturation (SPO2) levels in blood. Light is sent by a light emitter into the body, and the amount of reflective or unabsorbed light is measured with a photoreceiver. Depending on the ratio between two wavelengths, the amount of oxygenated hemoglobin can be measured. Comparable technologies are also used to measure heart rate with an optical technology or heart rate variability.
All these systems require one or more photoemitters, which need to be controlled, and a photodetector to measure the amount of photocurrent as a measure for the received light. This receive signal finally needs to be amplified, conditioned, and digitized. Such an optical system might sound straightforward; however, with a missing dose of optical knowledge, it is very easy to retrieve an optical signal, which doesn’t have anything to do with the signals the user is looking for.
To help companies achieve their optical objectives, a fully integrated optical module has been introduced. It has been tested and compared to a well-proven discrete optical system with outstanding results. You will read more about the results and methodologies behind this exercise.
Theory and Introduction to PPG Measurement
With an increased focus on home health, wellness, and prevention, a new market has been born around smart devices for tracking several vital parameters. Initially this started with chest straps—monitoring heart rate using a biopotential technology—but the last five to eight years have brought a big shift toward optical systems, making use of photoplethysmography (PPG). The big advantage of this technology is that we can measure at a single spot on the body, whereas biopotential systems require at least two electrodes that measure across the heart. This is not very user friendly, and, for that reason, interest in optical heart rate monitoring (HRM) and monitoring heart rate variability (HRV) has increased drastically.
While designing a system like this, there are several questions that need to be answered. What is the end application, at what location on the body do you want to measure, and how much time do you have for developing the system? Depending on the answers to these questions, the designer might follow a certain design route.
There are two different principles for measuring PPG. You can send light through a part of the body, such as finger or earlobe, and measure the amount of received or not absorbed light at the opposite side; or light is sent at the same side of the body where the amount of reflected light is being measured. Measuring by transmission through the body gives you roughly 40 dB to 60 dB more signal compared to a reflective system; however, in a reflective system you are free to choose where you place the sensor.
Because most users prefer sensor comfort over performance, reflective measurement became more popular. For that reason, this article will focus on reflective measurement only.
During the time span of a heartbeat, the flow and volume of blood in a cardiac system changes, resulting in a scattering of the amount of reflected light received. The wavelength of the light source that is used for measuring optical HRM/HRV depends not only on the location on the body where you are measuring, but also on the relative perfusion level, as well as the temperature and color tone of the tissue. In general, for devices worn at the wrist, where arteries are not located on top of the wrist, you need to pick up pulsatile components from veins and capillaries just under the skin surface. Green light in this situation gives the best results. At places where you have enough blood flow, like the upper arm, temple, or ear canal, red or infrared light might be more effective as they penetrate deeper into the tissue, resulting in a stronger receive signal.
ADPD188 Is Game Changing
When trade-offs such as sensor position and LED wavelength are being made, you need to select the most appropriate optical solution. There are many choices in terms of analog front ends, either discretely built or fully integrated, but there is also a wide offering of photodetectors and LEDs that can be selected. It is key to place the transmitter and receiver in such a way that you get the maximum amount of receive signal for every milliampere of transmit current used. This is called the current transfer ratio and is usually given in nA/mA. What is also important in an optical system is the modulation index, which is the amount of ac signal in relation to the optical dc offset. Modulation index improves when you increase the spacing between the photosensor and the LED. There is a certain sweet spot along the distance between photodetector and LEDs, and this is also dependent on the LED wavelength. In an improperly designed mechanical system, LED light can reach the photosensor directly without having penetrated the tissue. This results in a dc offset that will have a negative impact on the modulation index. It shows up as optical crosstalk, also known as internal light pollution (ILP).
To minimize design efforts and to shorten time to market, especially for companies with minimal optical knowledge, ADI built a fully integrated optical subsystem for reflective measurement. This is called ADPD188GG and contains everything needed to run an optical measurement. In Figure 2, a picture of this module is shown.
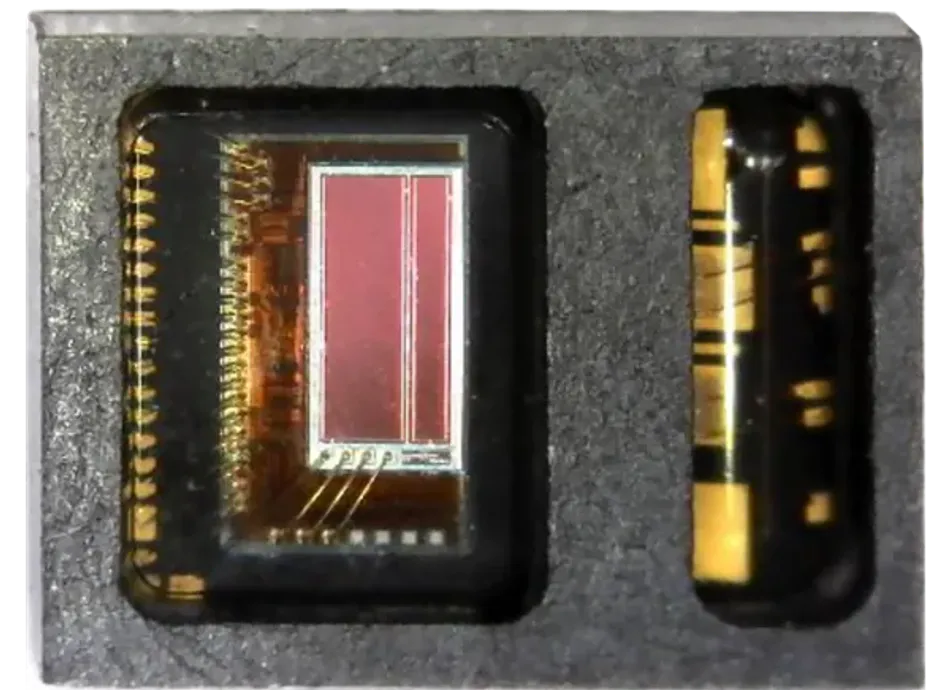
The ADPD188GG is a completely newly designed optical module with different dimensions compared to earlier generations. The form factor is almost square, 3.98 mm by 5.0 mm, with a total thickness of 0.9 mm. The biggest improvement is to the photodetector, which is rotated 90° from its predecessor. In relation to the LEDs, this sensor position provides a better sensitivity. The photosensor itself has been split into a size of 0.4 mm2 and 0.8 mm2. This provides flexibility to either increase the overall photodiode surface for more sensitivity or use a smaller size detector to prevent the sensor from saturation. The photodiode is placed on top of the analog front end. ADI is making use of the standalone ADPD1080 AFE. It has four input channels, each designed around a transimpedance amplifier with selectable gain (25k, 50k, 100k, and 200k), an ambient light rejection block, and a 14-bit SAR ADC. The ambient light rejection is done in the analog domain and is superb compared to other solutions on the market. Finally, the two green LEDs are controlled by integrated current sources, capable of driving currents up to 370 mA, and pulses as narrow as 1 μs, to reduce overall average current. The package is designed in such a way that transmitted LED light can hardly reach the photosensor without penetrating the tissue. This prevents optical crosstalk and provides the user the best modulation index, even when the sensor is placed under a glass or plastic window. This is a great feature when designing an optical reflective system. For those applications where transmissive measurement is preferred, the ADPD188GG can be used with externally connected LEDs and by having the internal LEDs bypassed.
Comparison to a Proven Solution
Before you start a new optical design, it is important to determine the target market and required specifications for the final product. An optical system with medical grade performance in general has higher specifications compared to a device intended for the sports and wellness market.
The ADPD107 is an analog optical front end designed for discrete optical systems. It is considered a gold standard among the optical front ends on the market, and due to its good performance, it is being used in many medical products. DataSenseLabs Ltd. has a lot of experience with the ADPD107. However, because a fully integrated optical module in certain use cases has advantages, it started to work with them and did a comparative analysis, comparing the ADPD107’s performance with the ADPD188GG integrated optical module. In the following sections you will read more about the test setup, configurations, and results.
Test Setup and Data Collection
For the optical comparison, raw PPG readings were recorded, simultaneously with the ADPD188GG and ADPD107, over a period of 2 minutes. For the ADPD188GG setup, the standard evaluation board was used, where the ADPD107 was part of the optical system inside the wearable demo platform (EVAL-HCRWATCH). Both systems have been controlled by Analog Devices’ user interface applications wavetool software.
For the test, configuration settings were optimized to achieve the highest signal quality. We kept the configuration of the AFEs, including the LED pulses, timing, and transimpedance gain within a specific range to achieve the same power consumption on both systems to get a fair comparison (see Table 1).
| ADPD188GG | ADPD107 | |
| Power Consumption (mW) | 5.1 | 5.2 |
| Sampling Frequency (Hz) | 100 | 100 |
| LED Current (mA) | 130.02 | 64.89 |
| Input Bias Current | 15nA | 80nA |
| AFE Width (μs) | 3 | 3 |
| Pulse Width (μs) | 2 | 2 |
| Pulse Offset (μs) | 32 | 25 |
| AFE Offset (μs) | 23 | 16 |
| AFE Fine Offset (ns) | 125 | 250 |
Table 1 shows an ADPD188GG LED current, which is twice as high as the LED current in the ADPD107 setup. The reason is that the photodiode surface of the integrated solution is smaller than the surface of the discrete solution, so we had to compensate for this. Having two LEDs, driven from a 3 V supply, adds 156 μW to the overall power dissipation, which is almost negligible compared to the total power dissipation. We sampled the ADC at a rate of 100 Hz, which is common in a wearable system. In addition, we measured at a 500 Hz sampling rate, which is often used for systems with clinical performance.
The data recording was taken under the same circumstances as a normal smartwatch or fitness tracker, with the optical sensor attached to the top of the wrist. Because the microcirculation and vasoconstriction properties can be slightly different between the subdermal layers of the dominant hand and the nondominant hand, the recordings were repeated on both wrists by both optical systems. Datasets collected from the left and right wrists were analyzed and compared carefully to avoid position-specific influence on the signal quality. PPG datasets were recorded on 11 different users (subjects) while they were seated and under the same ambient light intensity conditions.
Data Analysis and Statistics
It is very important to take a comparative approach because signal quality validation does not only mean hard science signal processing, data analysis, and statistics, but it also has to do with what the market and end user are expecting. To be successful in the wearable market you need well-defined use cases and a clear objective of what outcome you want to get from the optical signal.
Optical heart rate monitors are strongly connected to fitness tracking and wellness monitoring applications, but there are many use cases where optical technology can be found in medical grade systems. In a fitness, health informatics, or medical related use case, the accuracy of the peak detection algorithm depends primarily on the raw data quality around the local maximum of the PPG signal. Accurate peak detection is not only the principal of heart rate or HRV measurement, it is also extremely important for PPG-based blood pressure estimation detection. So, the designer must choose the sensor platform that gives the best physical signal quality if the finally extracted and calculated PPG signals are supposed to support health related applications. Comparative measurement configuration and data analysis was designed and carried out based on the Biosignal Metrology patent (pending ID: P1900302) owned by János Pálhalmi.1
The Final Results
To support a peak detection algorithm, baseline fluctuations within the PPG raw data can easily be subtracted and filtered. In parallel, high signal quality around the peaks is needed at the raw data level to extract the targeted results as mentioned above. That is why in this study we focused on the comparative analysis of the major frequency bands around the peaks of the PPG signals measured by the gold standard ADPD107 and the new integrated ADPD188GG optical module. Major components of the signals were not modified, except the very slow baseline fluctuations (<0.25 Hz) and the high frequency components (>40 Hz), which were filtered.
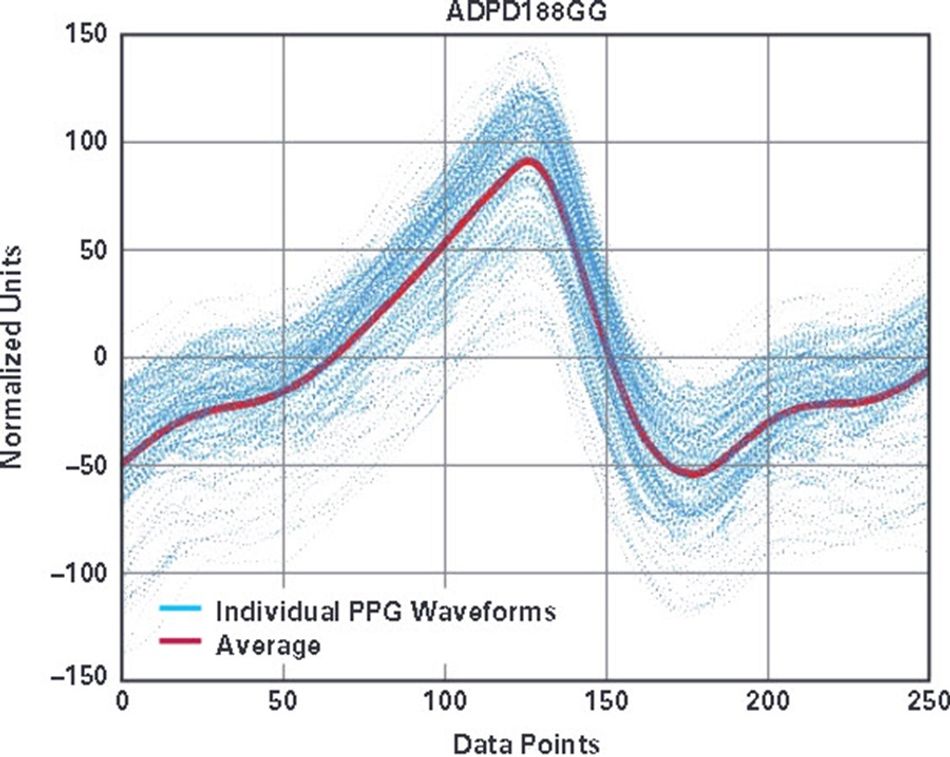
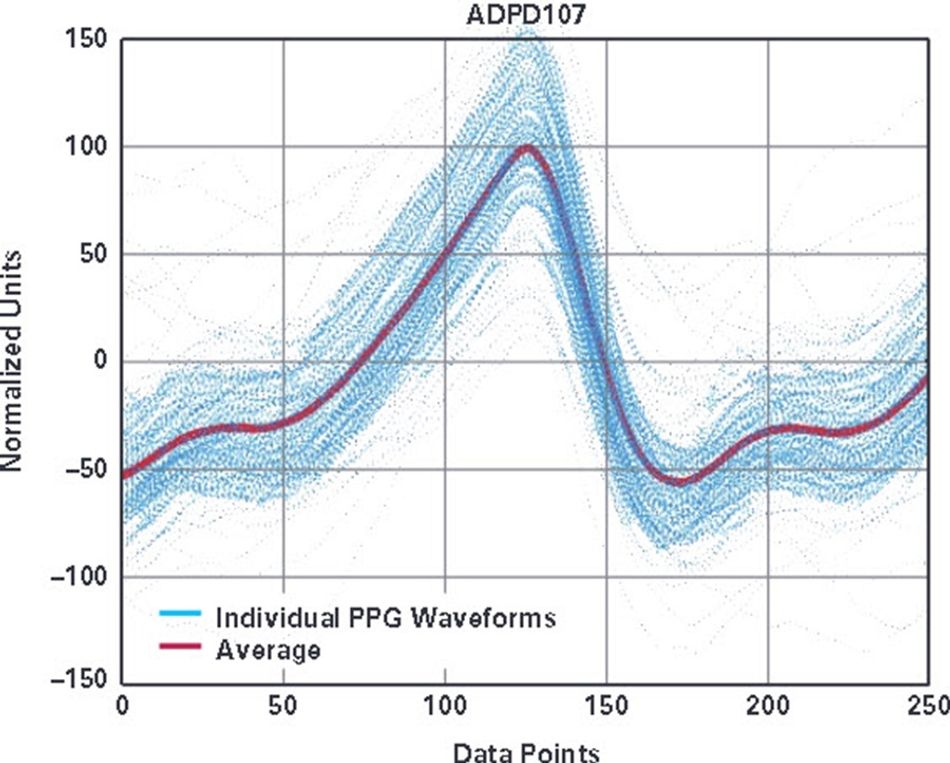
Wavelet coherence and correlated comparisons were computed to compare the stability of the two signals within the most dominant frequency range. Figure 3 shows almost identical patterns of the results of the two PPG systems at the level of individual waveforms and their averages.
To continue the comparison at the deep data level, two different correlation-based methods were applied. Correlation coefficients and P values (R, P) were computed between every upcoming PPG wave, following each other. A different kind of variability of the signals was also tested by comparing every individual PPG waveform to the average.
Based on the comprehensive correlation tests, we can conclude that it was not possible to observe any significant difference between the two compared PPG systems, neither on the level of the individual waveforms nor on the level of the individual waveforms vs. averages.
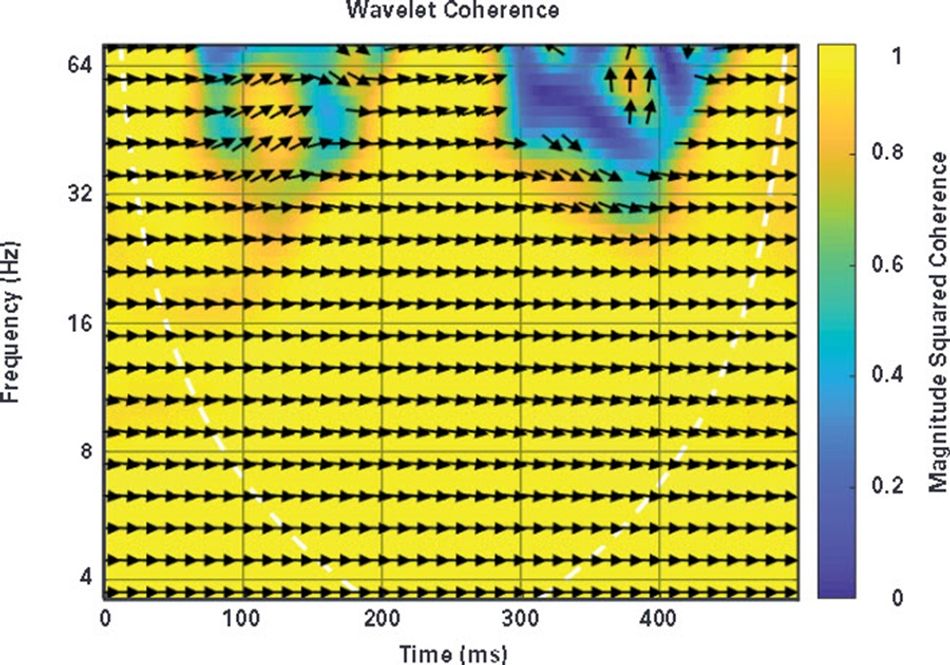
Wavelet methodologies are very sensitive to differences in specific frequency bands. For that reason, wavelet coherence functions were calculated to compare the two PPG signals. Based on the results analyzed in the case of all 11 subjects, no significant difference was observed in the frequency domain or in the phase domain between the two signals (see Figure 4).
While developing a new product, it might also be helpful to look at the specific frequency bands, which can be extracted from a given signal, to be able to optimize the specifications.
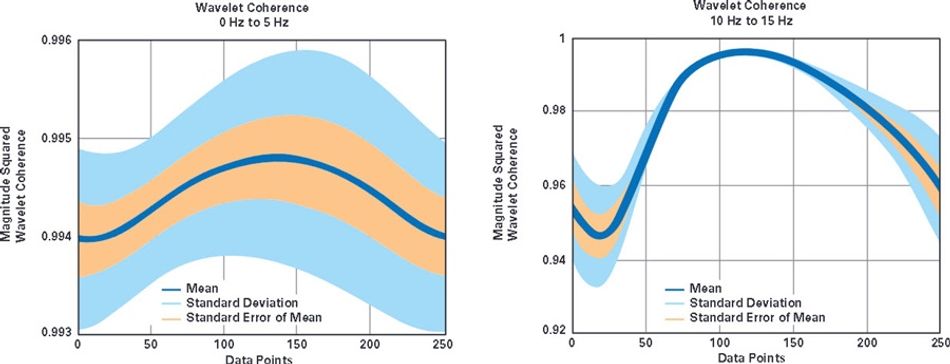
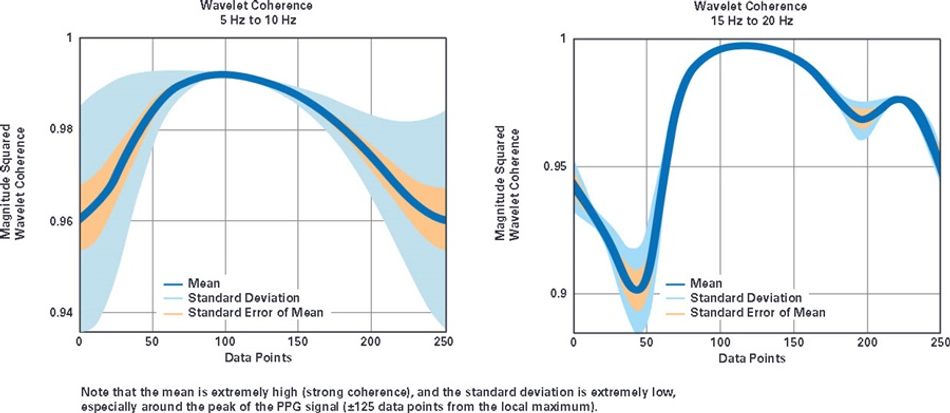
In this test, basic statistical properties of the magnitude squared coherence between the two compared PPG systems were analyzed within all the relevant frequency ranges, as shown in Figure 5. The entire spectrum was divided into six specific frequency ranges to analyze the variability of similarities between the signals.
For all 11 subjects the coherence value was higher than 0.95 within all the frequency bands around the peak of the PPG signals, which tells us that there is a very high similarity between the gold standard and the new integrated ADPD188GG.
Conclusion
The ADPD188GG is a fully integrated optical module targeted for measuring heart rate, heart rate variability, and oxygen saturation, and for monitoring continuous blood pressure estimation. Because the module includes optics and electronics in a tiny package, it helps the designer and companies without optical knowledge to shorten their overall design cycle. The module is optimized for applications where reflective measurement methodology is used with wavelengths at 525 nm; however, external LEDs can also be used to measure at different wavelengths or to measure based on a transmissive principle. We have proven that the integrated system is not limiting us to meet the required specification for the various use cases in both out-of-hospital or clinical-based systems.
References
1 János Pálhalmi. Biosignal Metrology patent, P1900302.